Datasource MicrometerでSpring BootアプリのJDBC操作を計測する
Note
2026-02-04 datasource-micrometer-opentelemetryの説明を追加。
Datasource Micrometer (ドキュメントリンク) は、JDBC の Proxy であり、JDBC の操作を Micrometer の Observation API で計測して、Observability を高められます。Trace、Metrics だけでなく、SQL ログやスローログも取得可能です。現在は Micrometer とは独立した開発になっていますが、Micrometer と近い位置で開発されています。
Datasource Micrometer は 2025 年末あたりから Spring Initializr からも選択可能になり、便利に利用できるようになりました。Datasource Micrometer 1 系は Spring Boot 3.5 系で、Datasource Micrometer 2 系は Spring Boot 4 系で利用可能です。

題材アプリとして、簡単な Counter API を作成します。次のコマンドでプロジェクトの雛形を作成します。
curl -s https://start.spring.io/starter.tgz \
       -d artifactId=counter-api\
       -d name=counter-api \
       -d baseDir=counter-api \
       -d packageName=com.example \
       -d dependencies=web,jdbc,postgresql,actuator,configuration-processor,opentelemetry,datasource-micrometer,testcontainers \
       -d type=maven-project \
       -d applicationName=CounterApiApplication | tar -xzvf -
cd counter-api
すでに Datasource Micrometer の dependency は設定済みです。dependenciesにdatasource-micrometerを含めない場合に比べて、以下の設定が追加されます。
30a31
> 		<datasource-micrometer.version>2.1.0</datasource-micrometer.version>
48a50,57
> 		<dependency>
> 			<groupId>net.ttddyy.observation</groupId>
> 			<artifactId>datasource-micrometer-opentelemetry</artifactId>
> 		</dependency>
> 		<dependency>
> 			<groupId>net.ttddyy.observation</groupId>
> 			<artifactId>datasource-micrometer-spring-boot</artifactId>
> 		</dependency>
95a105,115
> 	<dependencyManagement>
> 		<dependencies>
> 			<dependency>
> 				<groupId>net.ttddyy.observation</groupId>
> 				<artifactId>datasource-micrometer-bom</artifactId>
> 				<version>${datasource-micrometer.version}</version>
> 				<type>pom</type>
> 				<scope>import</scope>
> 			</dependency>
> 		</dependencies>
> 	</dependencyManagement>
dependenciesにopentelemetryも含まれる場合は、datasource-micrometer-opentelemetryも合わせて追加されます。
せっかくなので こちらの記事 で紹介した、OpenTelemetry Logback Appender の AutoConfiguration も追加します。
<dependency>
    <groupId>am.ik.spring.opentelemetry</groupId>
    <artifactId>otel-logs-autoconfigure</artifactId>
    <version>0.5.0</version>
</dependency>
簡単な API を実装します。
cat <<EOF > src/main/java/com/example/CounterController.java
package com.example;

import java.util.List;

import org.slf4j.Logger;
import org.slf4j.LoggerFactory;
import org.springframework.jdbc.core.simple.JdbcClient;
import org.springframework.transaction.annotation.Transactional;
import org.springframework.web.bind.annotation.GetMapping;
import org.springframework.web.bind.annotation.PostMapping;
import org.springframework.web.bind.annotation.RequestBody;
import org.springframework.web.bind.annotation.RestController;

@RestController
public class CounterController {

	private final JdbcClient jdbcClient;

	private final Logger logger = LoggerFactory.getLogger(this.getClass());

	public CounterController(JdbcClient jdbcClient) {
		this.jdbcClient = jdbcClient;
	}

	@PostMapping(path = "/counter")
	@Transactional
	public CounterResponse increment(@RequestBody CounterRequest request) {
		CounterResponse counterResponse = this.jdbcClient.sql("""
				INSERT INTO counters (entry_id, counter)
				VALUES (?, 1)
				ON CONFLICT (entry_id)
				DO UPDATE
				  SET counter = counters.counter + 1
				RETURNING entry_id, counter
				""").param(request.entryId()).query(CounterResponse.class).single();
		logger.atInfo()
			.addKeyValue("entryId", counterResponse.entryId())
			.addKeyValue("counter", counterResponse.counter())
			.log("event=increment entryId={} counter={}", counterResponse.entryId(), counterResponse.counter());
		return counterResponse;
	}

	@GetMapping(path = "/counter")
	public List<CounterResponse> getAll() {
		return this.jdbcClient.sql("""
				SELECT entry_id, counter FROM counters ORDER BY counter DESC
				""").query(CounterResponse.class).list();
	}

	public record CounterRequest(int entryId) {
	}

	public record CounterResponse(int entryId, long counter) {
	}

}
EOF
application.properties を設定します。Datasource Micrometer による SQL ログとスロークエリログの設定を行います。
cat <<EOF >> src/main/resources/application.properties
jdbc.datasource-proxy.json-format=true
jdbc.datasource-proxy.logging=slf4j
jdbc.datasource-proxy.multiline=false
jdbc.datasource-proxy.query.enable-logging=true
jdbc.datasource-proxy.slow-query.enable-logging=true
jdbc.datasource-proxy.slow-query.threshold=5
logging.level.net.ttddyy.dsproxy.listener.logging.SLF4JQueryLoggingListener=debug
management.opentelemetry.instrumentation.logback-appender.capture-experimental-attributes=true
management.opentelemetry.instrumentation.logback-appender.capture-key-value-pair-attributes=true
management.otlp.metrics.export.base-time-unit=seconds
management.otlp.metrics.export.step=30s
management.tracing.sampling.probability=1.0
spring.sql.init.mode=always
EOF
簡単なスキーマを定義します。
cat <<EOF > src/main/resources/schema.sql
CREATE TABLE IF NOT EXISTS counters
(
    entry_id BIGINT PRIMARY KEY,
    counter  BIGINT NOT NULL
);
EOF
次のコマンドを実行すると、Testcontainers を使った PostgreSQL と LGTM スタック のローカル開発用コンテナが立ち上がります (src/test/java/com/example/TestcontainersConfiguration.java を確認してみてください)。DataSource の設定や OTLP エンドポイントの設定は自動で行われます。
./mvnw spring-boot:test-run
起動時に次のようなログが出力され、Grafana の URL がわかります。
2026-01-26T13:08:41.512+09:00  INFO 28654 --- [counter-api] [           main] [                                                 ] tc.grafana/otel-lgtm:latest              : Creating container for image: grafana/otel-lgtm:latest
2026-01-26T13:08:41.579+09:00  INFO 28654 --- [counter-api] [           main] [                                                 ] tc.grafana/otel-lgtm:latest              : Container grafana/otel-lgtm:latest is starting: e0bb34b52593b45152a1236b6766c8ba2b1d3949b5ade2f4126dfbe8bf681790
2026-01-26T13:08:46.762+09:00  INFO 28654 --- [counter-api] [           main] [                                                 ] tc.grafana/otel-lgtm:latest              : Container grafana/otel-lgtm:latest started in PT5.249929S
2026-01-26T13:08:46.762+09:00  INFO 28654 --- [counter-api] [           main] [                                                 ] o.t.grafana.LgtmStackContainer           : Access to the Grafana dashboard: http://localhost:35507
2026-01-26T13:08:46.862+09:00  INFO 28654 --- [counter-api] [           main] [                                                 ] i.m.c.instrument.push.PushMeterRegistry  : Publishing metrics for OtlpMeterRegistry every 30s to http://localhost:35511/v1/metrics with resource attributes {service.name=counter-api}
適当にリクエストを送ります。
curl -s http://localhost:8080/counter --json '{"entryId":100}'
curl -s http://localhost:8080/counter
次のような SQL ログを確認できます。
2026-01-26T14:11:44.165+09:00 DEBUG 28654 --- [counter-api] [nio-8080-exec-1] [382b35f274086c23f3a45d4c94cfb785-6c507dd2b93e2c20] n.t.d.l.l.SLF4JQueryLoggingListener      : {"name":"test", "connection":4, "time":2, "success":true, "type":"Prepared", "batch":false, "querySize":1, "batchSize":0, "query":["INSERT INTO counters (entry_id, counter)\nVALUES (?, 1)\nON CONFLICT (entry_id)\nDO UPDATE\n  SET counter = counters.counter + 1\nRETURNING entry_id, counter\n"], "params":[["100"]]}
2026-01-26T14:11:44.169+09:00  INFO 28654 --- [counter-api] [nio-8080-exec-1] [382b35f274086c23f3a45d4c94cfb785-25067aeeaad66229] com.example.CounterController            : event=increment entryId=100 counter=1
2026-01-26T14:11:45.923+09:00 DEBUG 28654 --- [counter-api] [nio-8080-exec-3] [1a250337750c5fbed850028f8fe5c636-72c7abbd0c14e831] n.t.d.l.l.SLF4JQueryLoggingListener      : {"name":"test", "connection":5, "time":0, "success":true, "type":"Prepared", "batch":false, "querySize":1, "batchSize":0, "query":["SELECT entry_id, counter FROM counters ORDER BY counter DESC\n"], "params":[[]]}
次に、以下のコマンドで vegeta を使い、負荷をかけてみます。
for round in $(seq 20); do
  echo "=== Round $round/20 ==="
  for i in $(seq 3000); do
    id=$((RANDOM % 50 + 1))
    if [ $((RANDOM % 3)) -eq 0 ]; then
      echo '{"method":"GET","url":"http://localhost:8080/counter"}'
    else
      echo '{"method":"POST","url":"http://localhost:8080/counter","header":{"Content-Type":["application/json"]},"body":"'$(echo -n "{\"entryId\":$id}" | base64)'"}'
    fi
  done | vegeta attack -rate=100 -duration=30s -format=json | vegeta report
done
Grafanaで確認
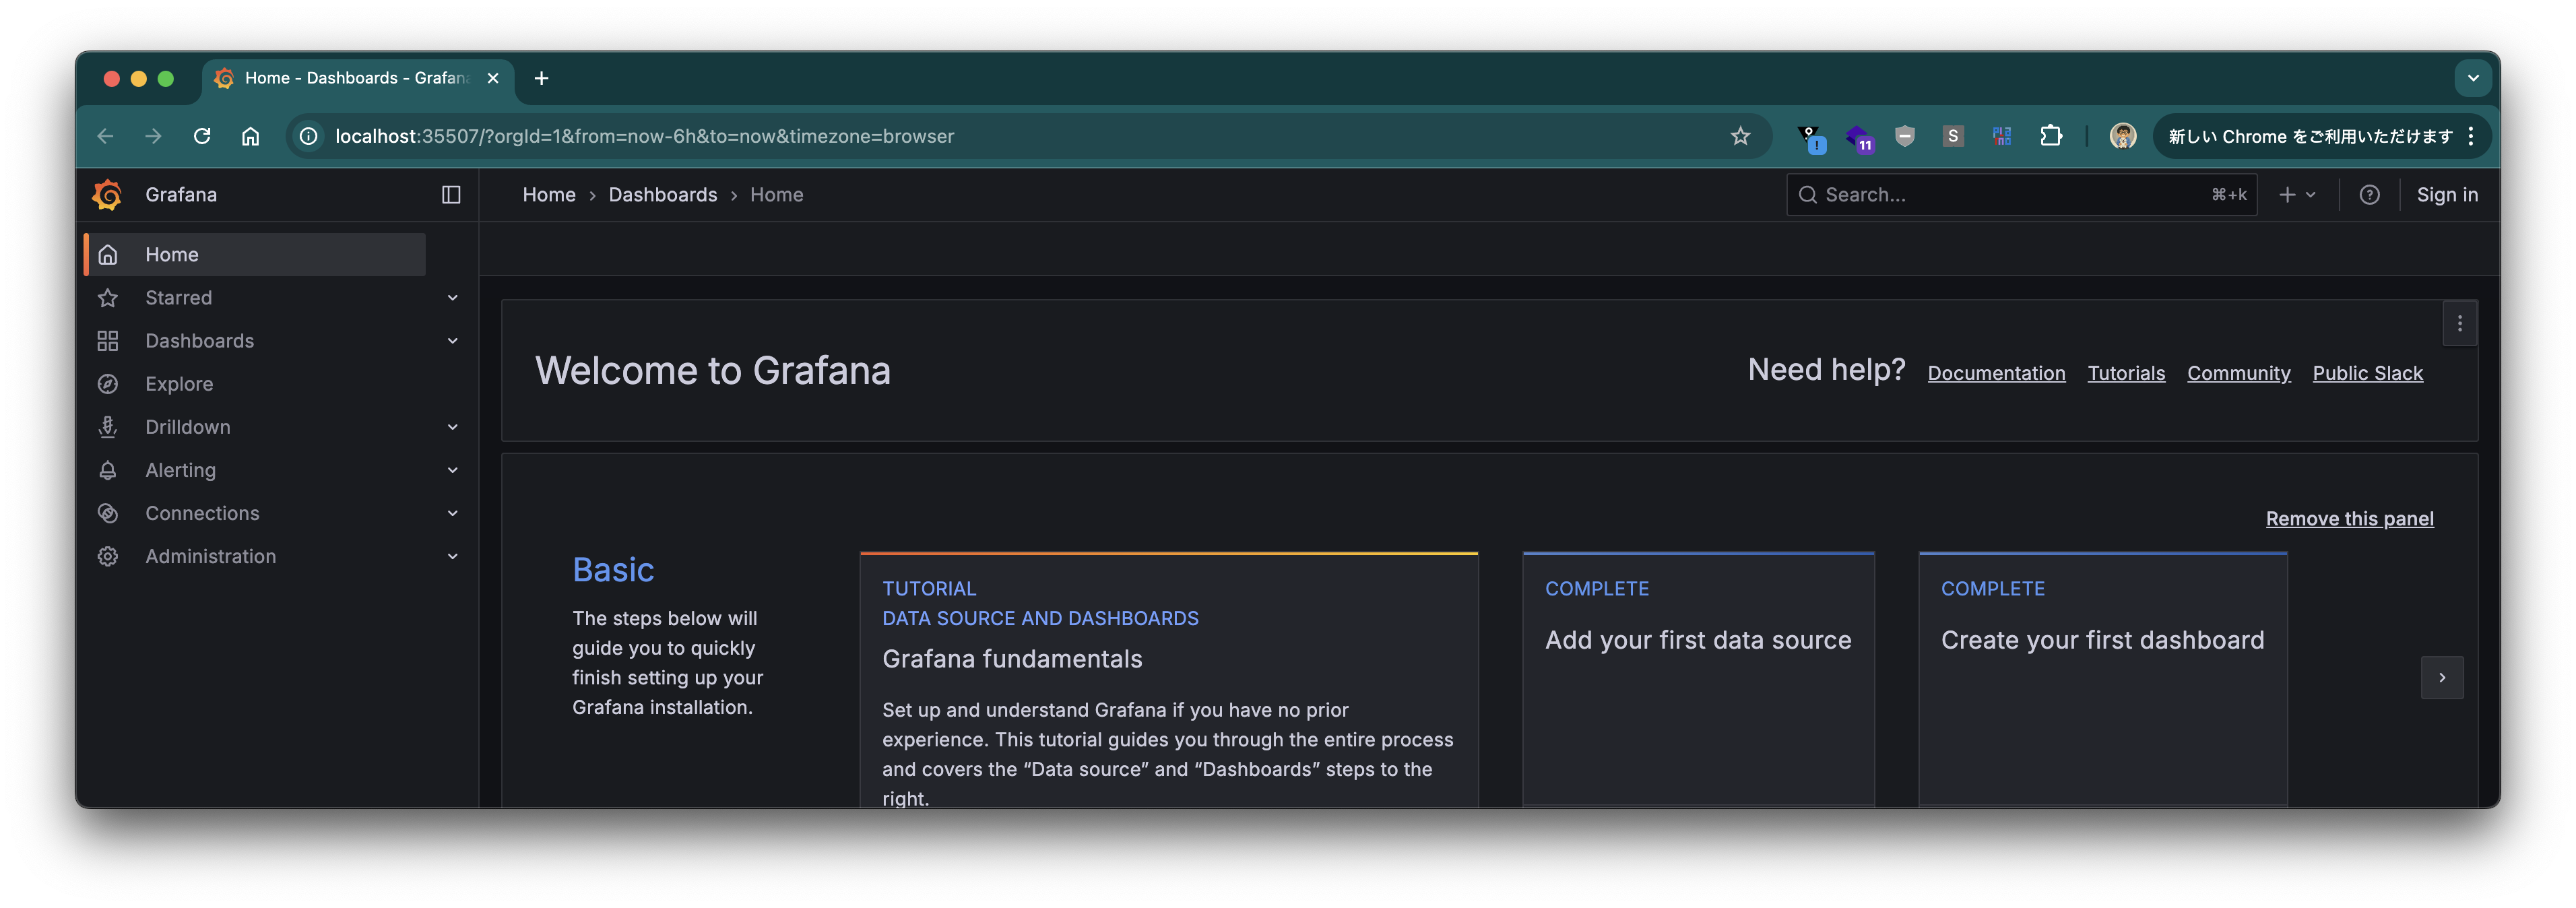
Grafana にアクセスします。Grafana の URL はログに出力されています。
Traces
左のメニューの Drilldown から "Traces" を選択します。
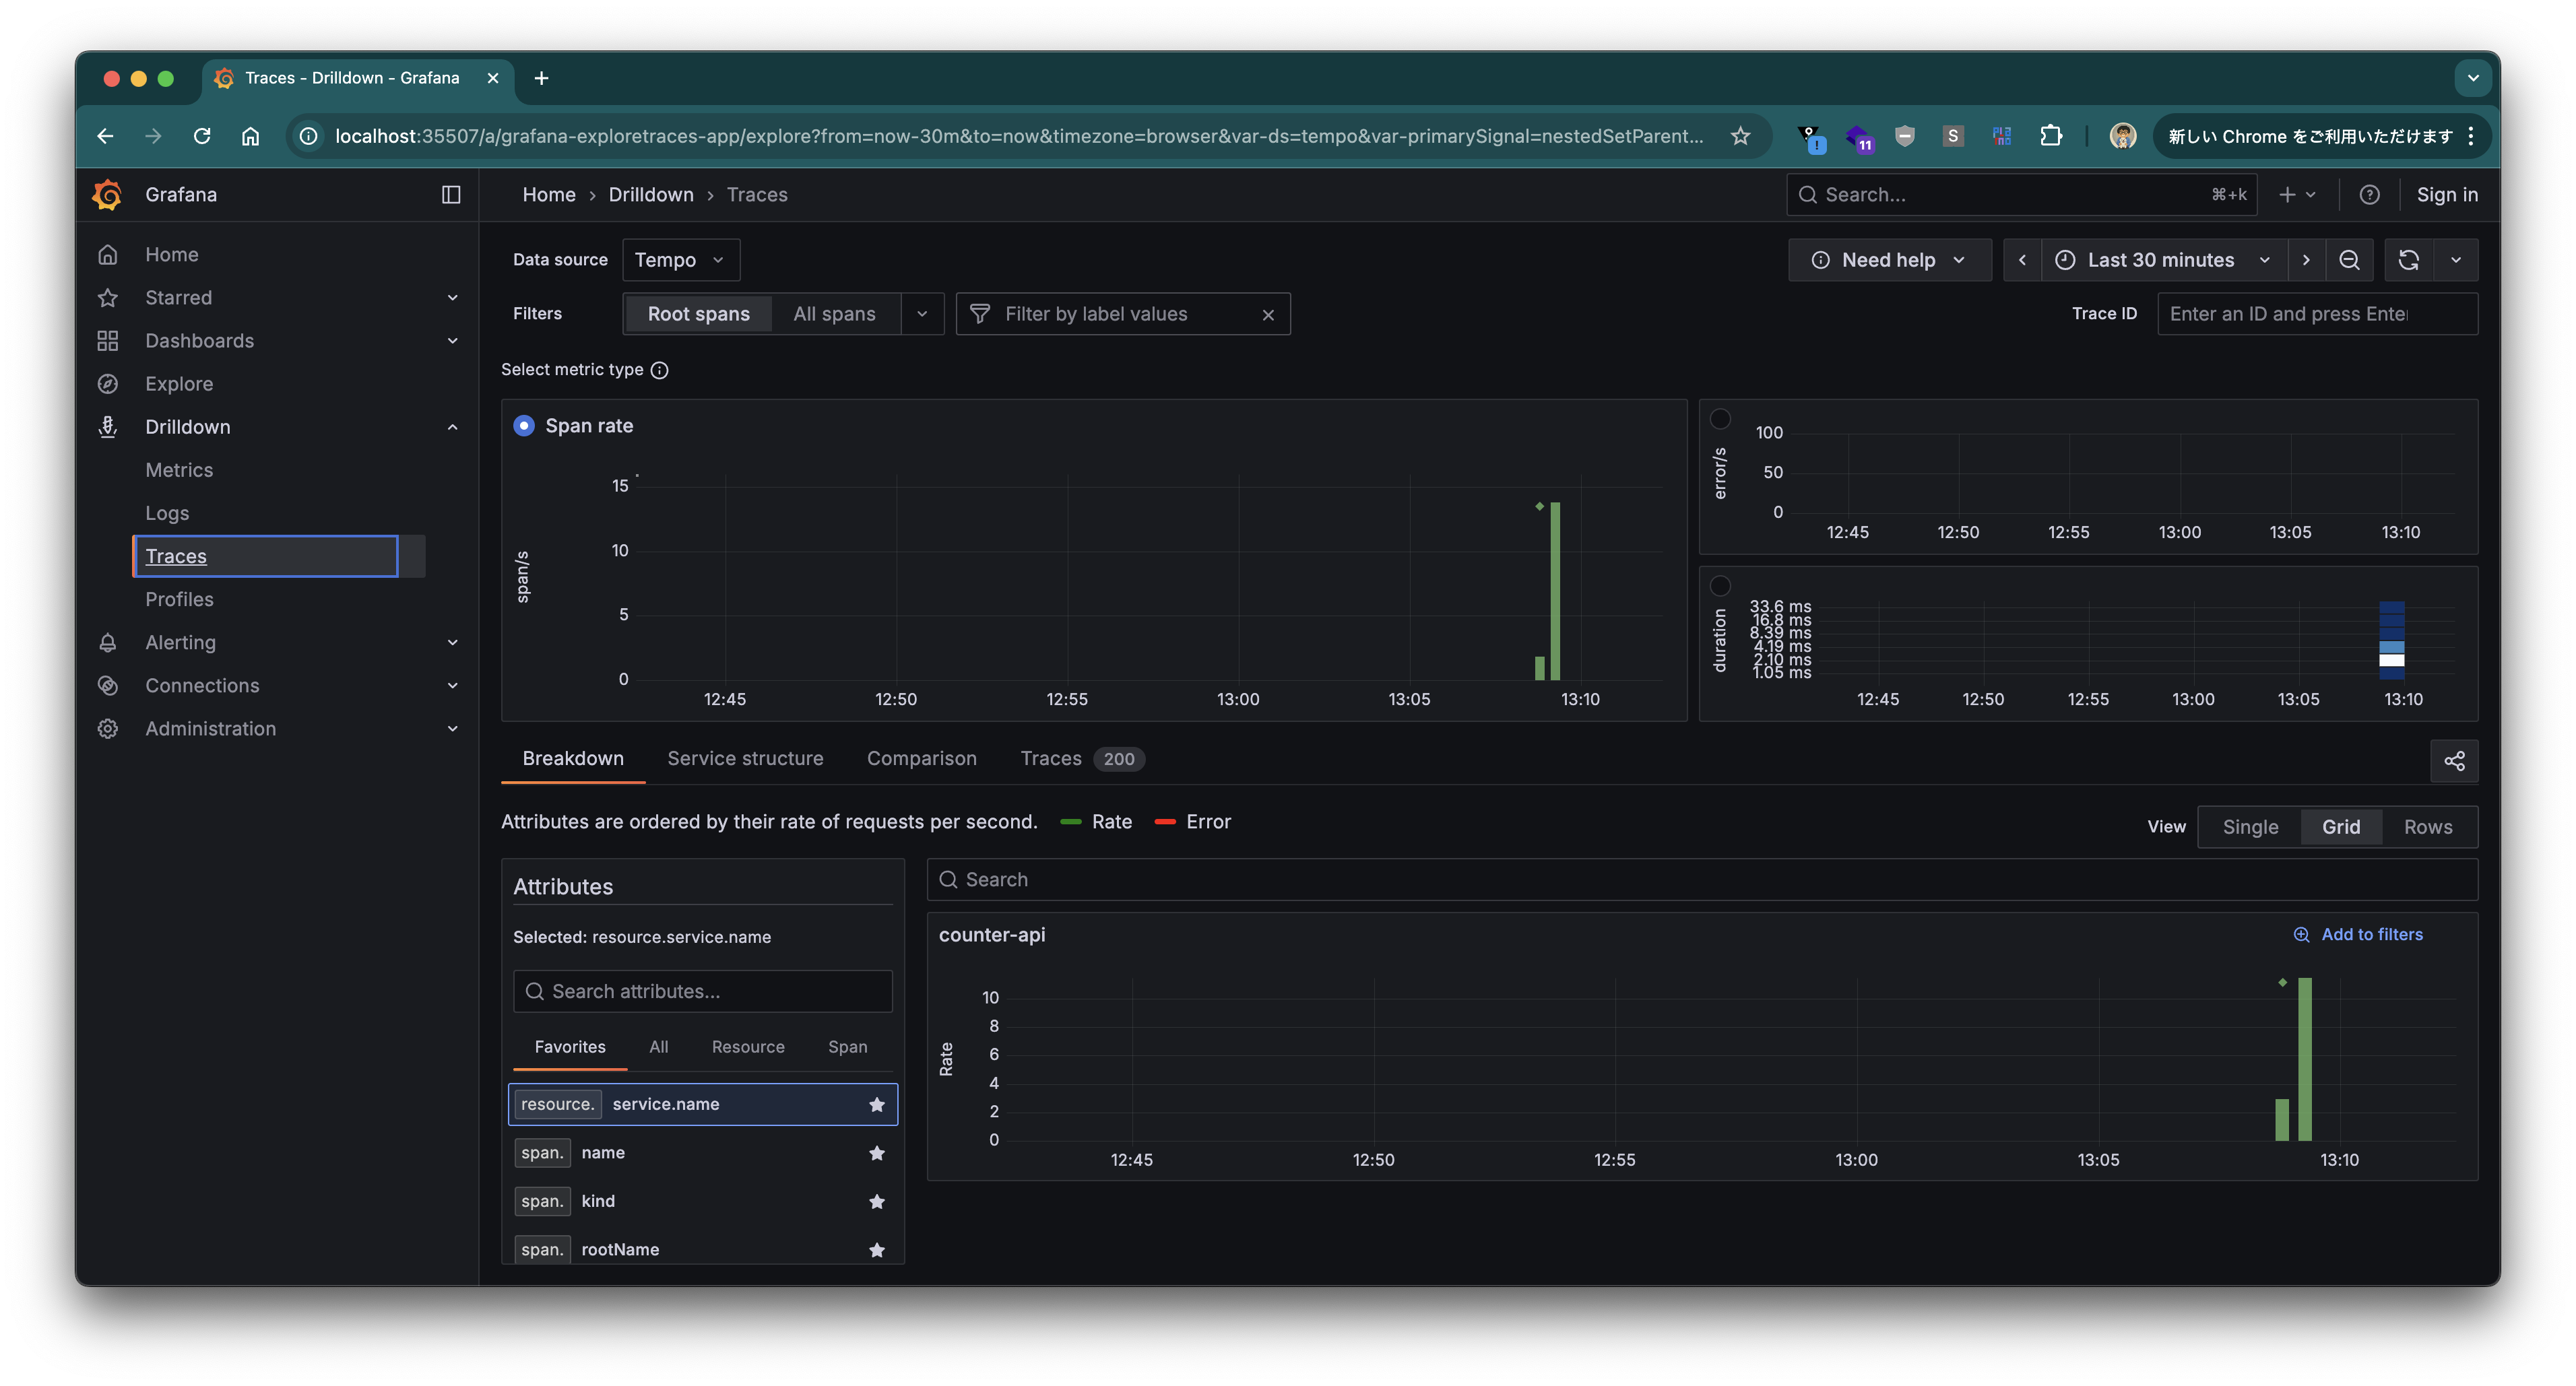
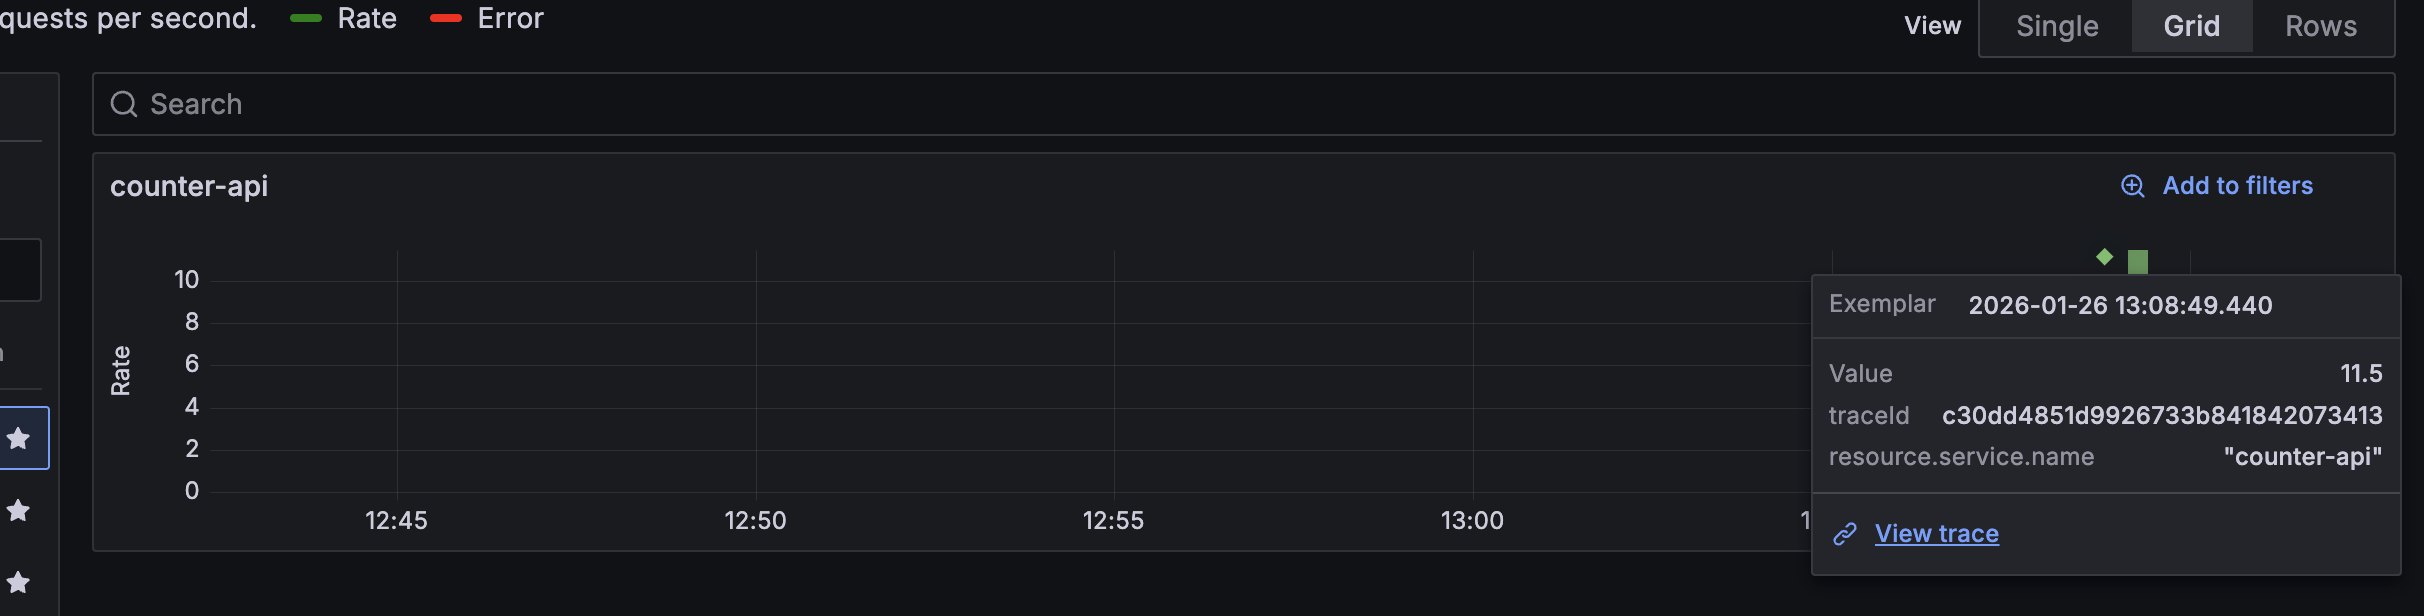
Span Rate の ◇ マーク (Exemplar、代表点) をクリックし、"View trace" リンクをクリックします。
そのリクエストの Trace View が表示されます。
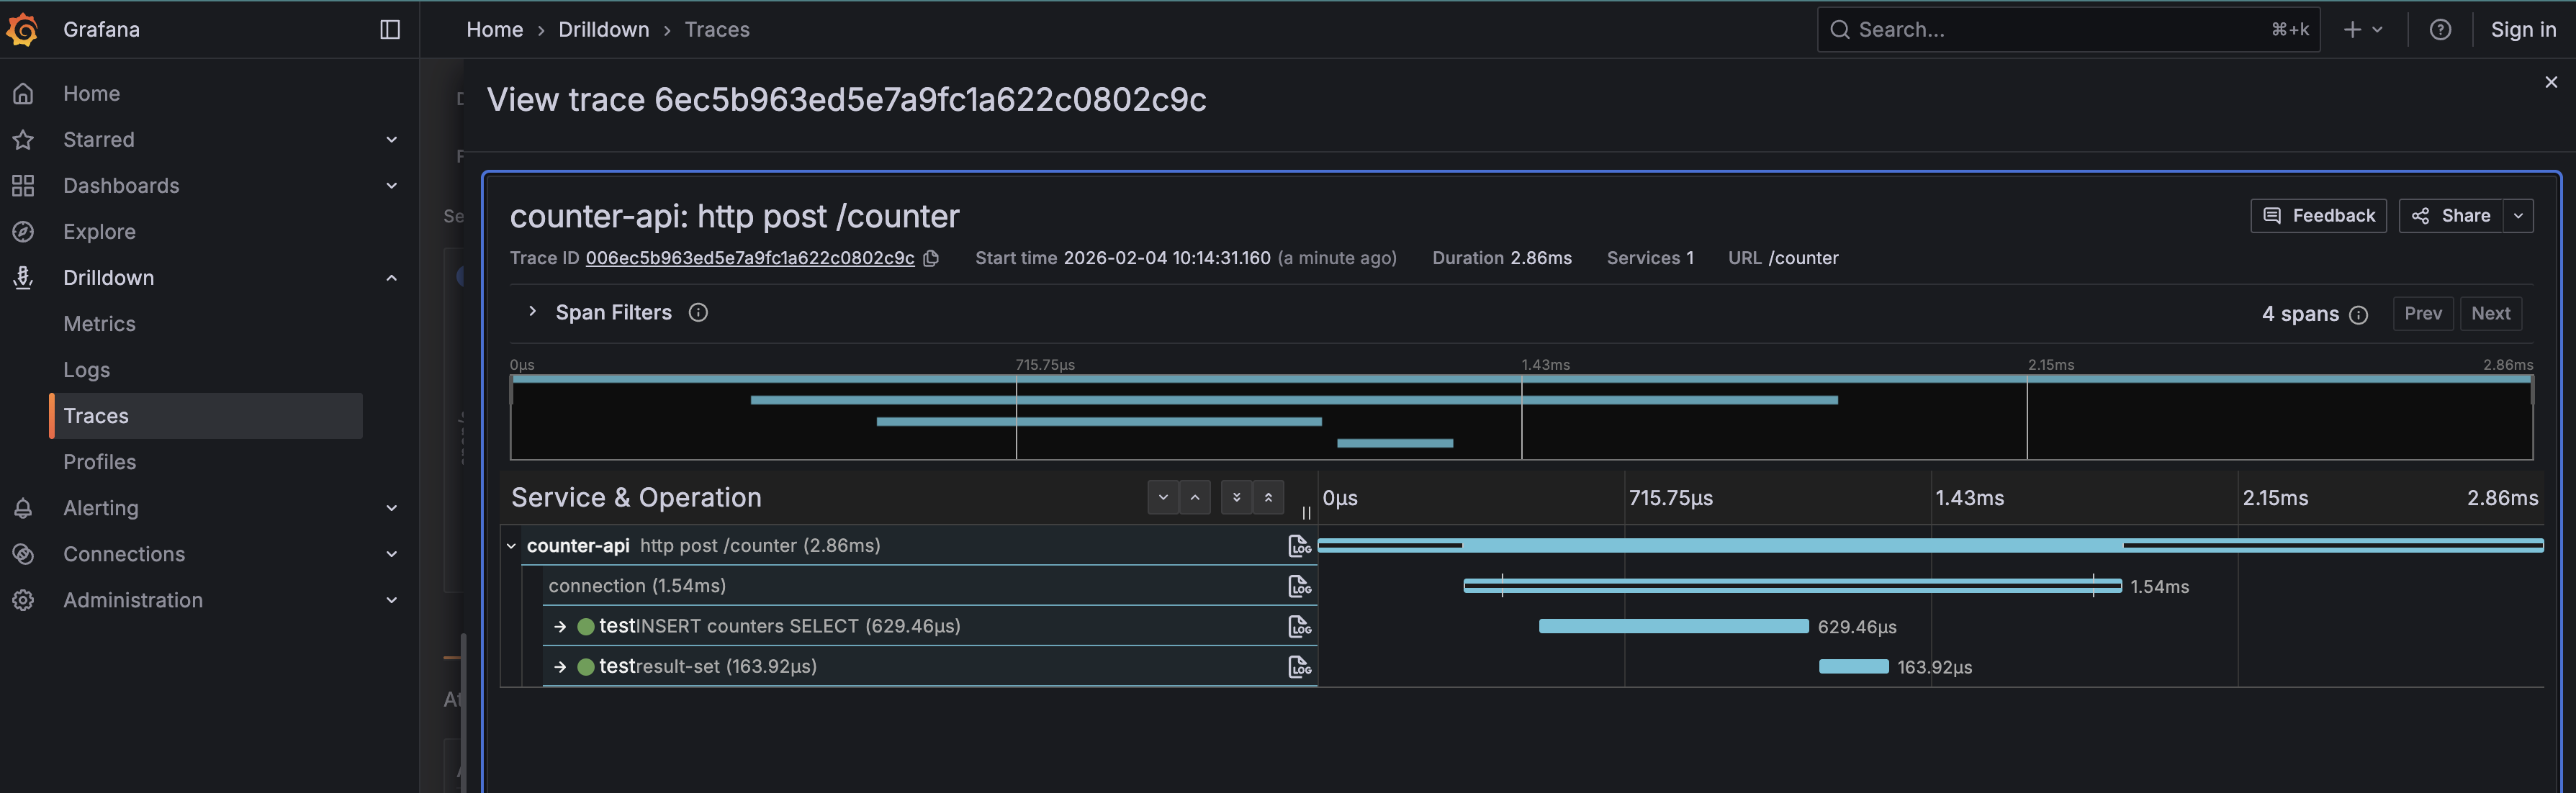
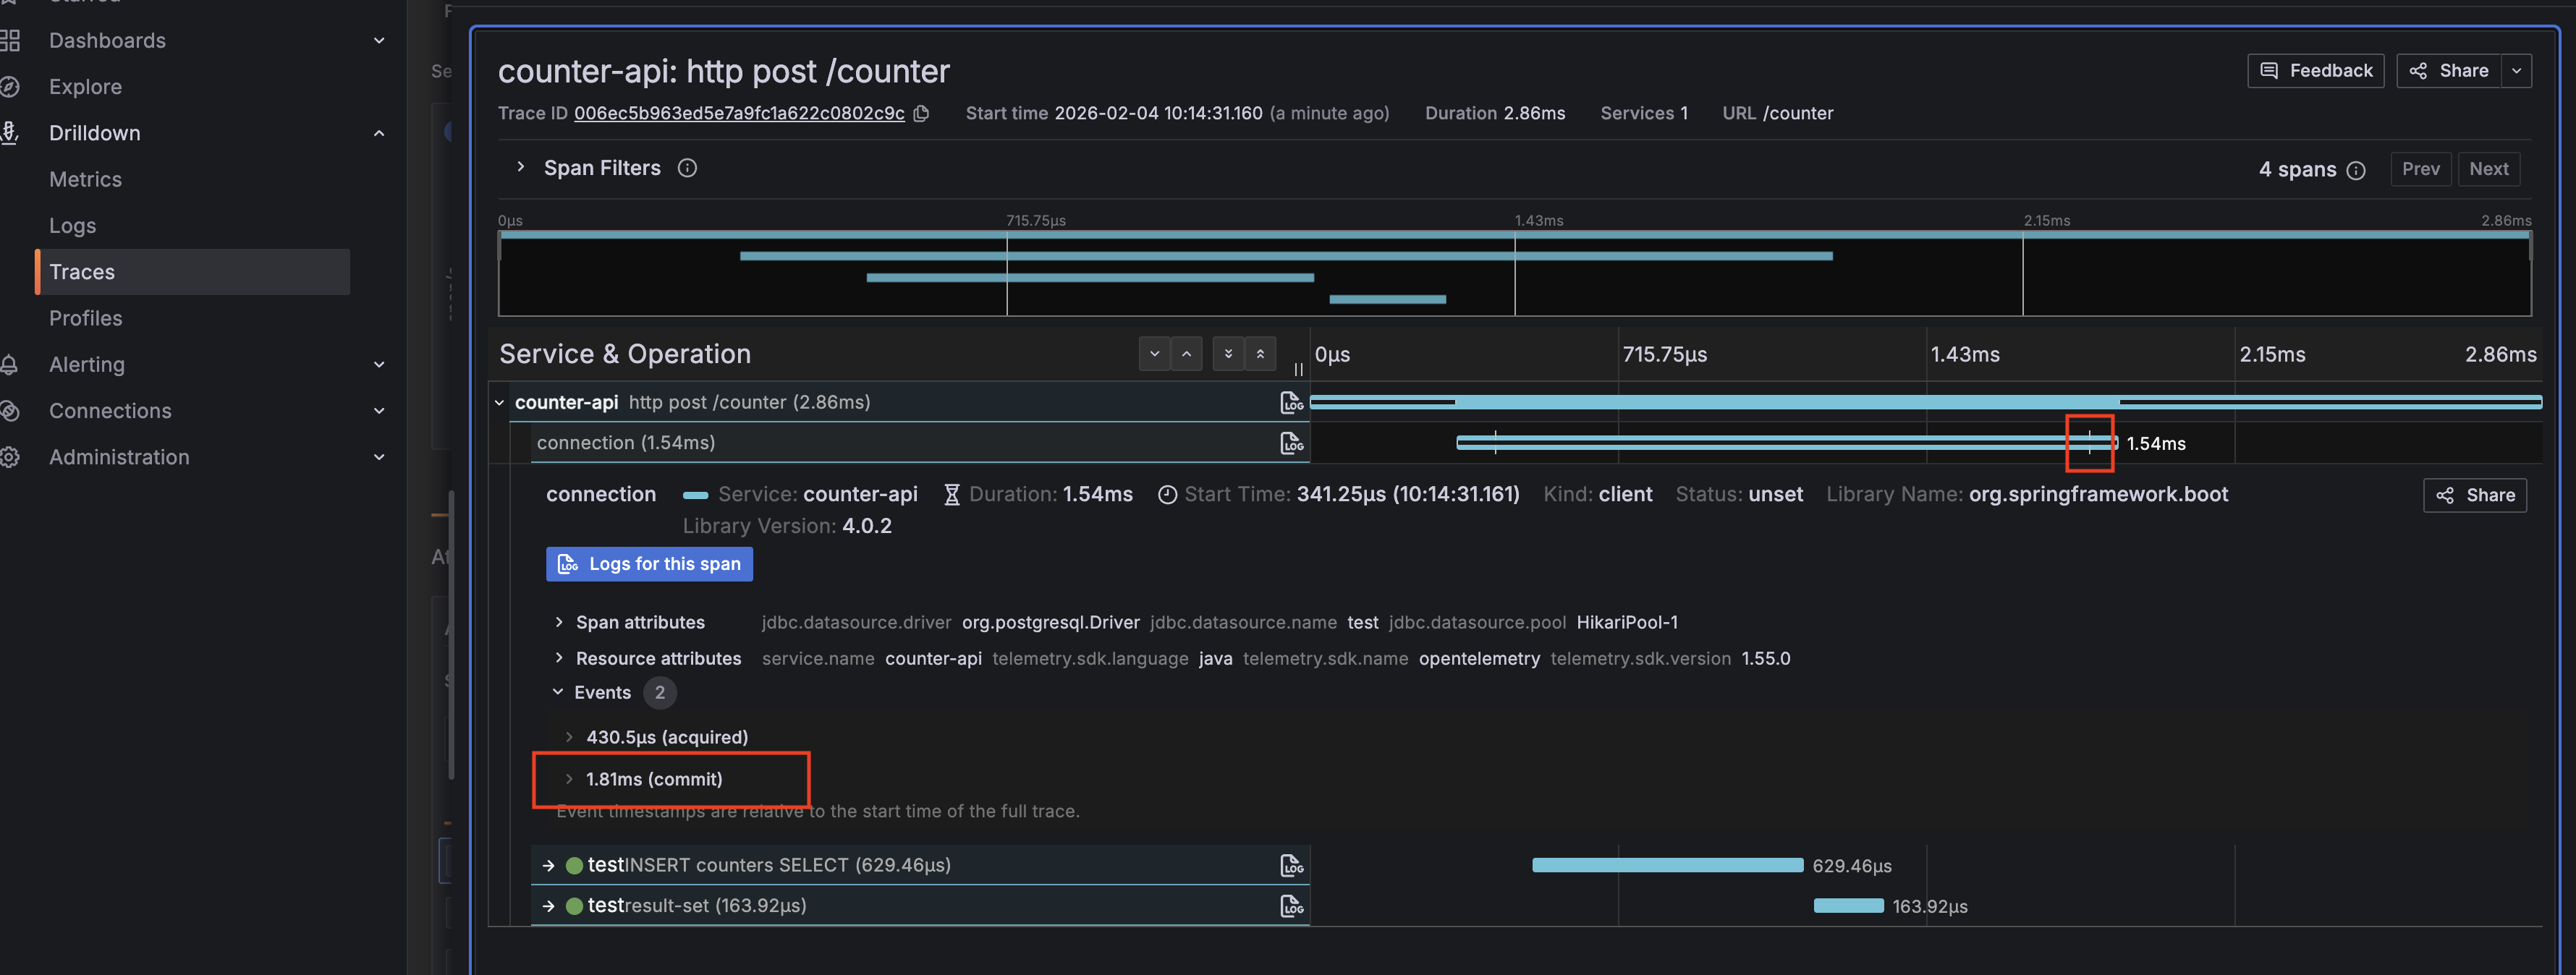
"connection" Span をクリックすると、commitのタイミング/回数や時間を確認することができます。
"INSERT ..." Span をクリックすると、そのタイミングでの SQL を確認することができます。
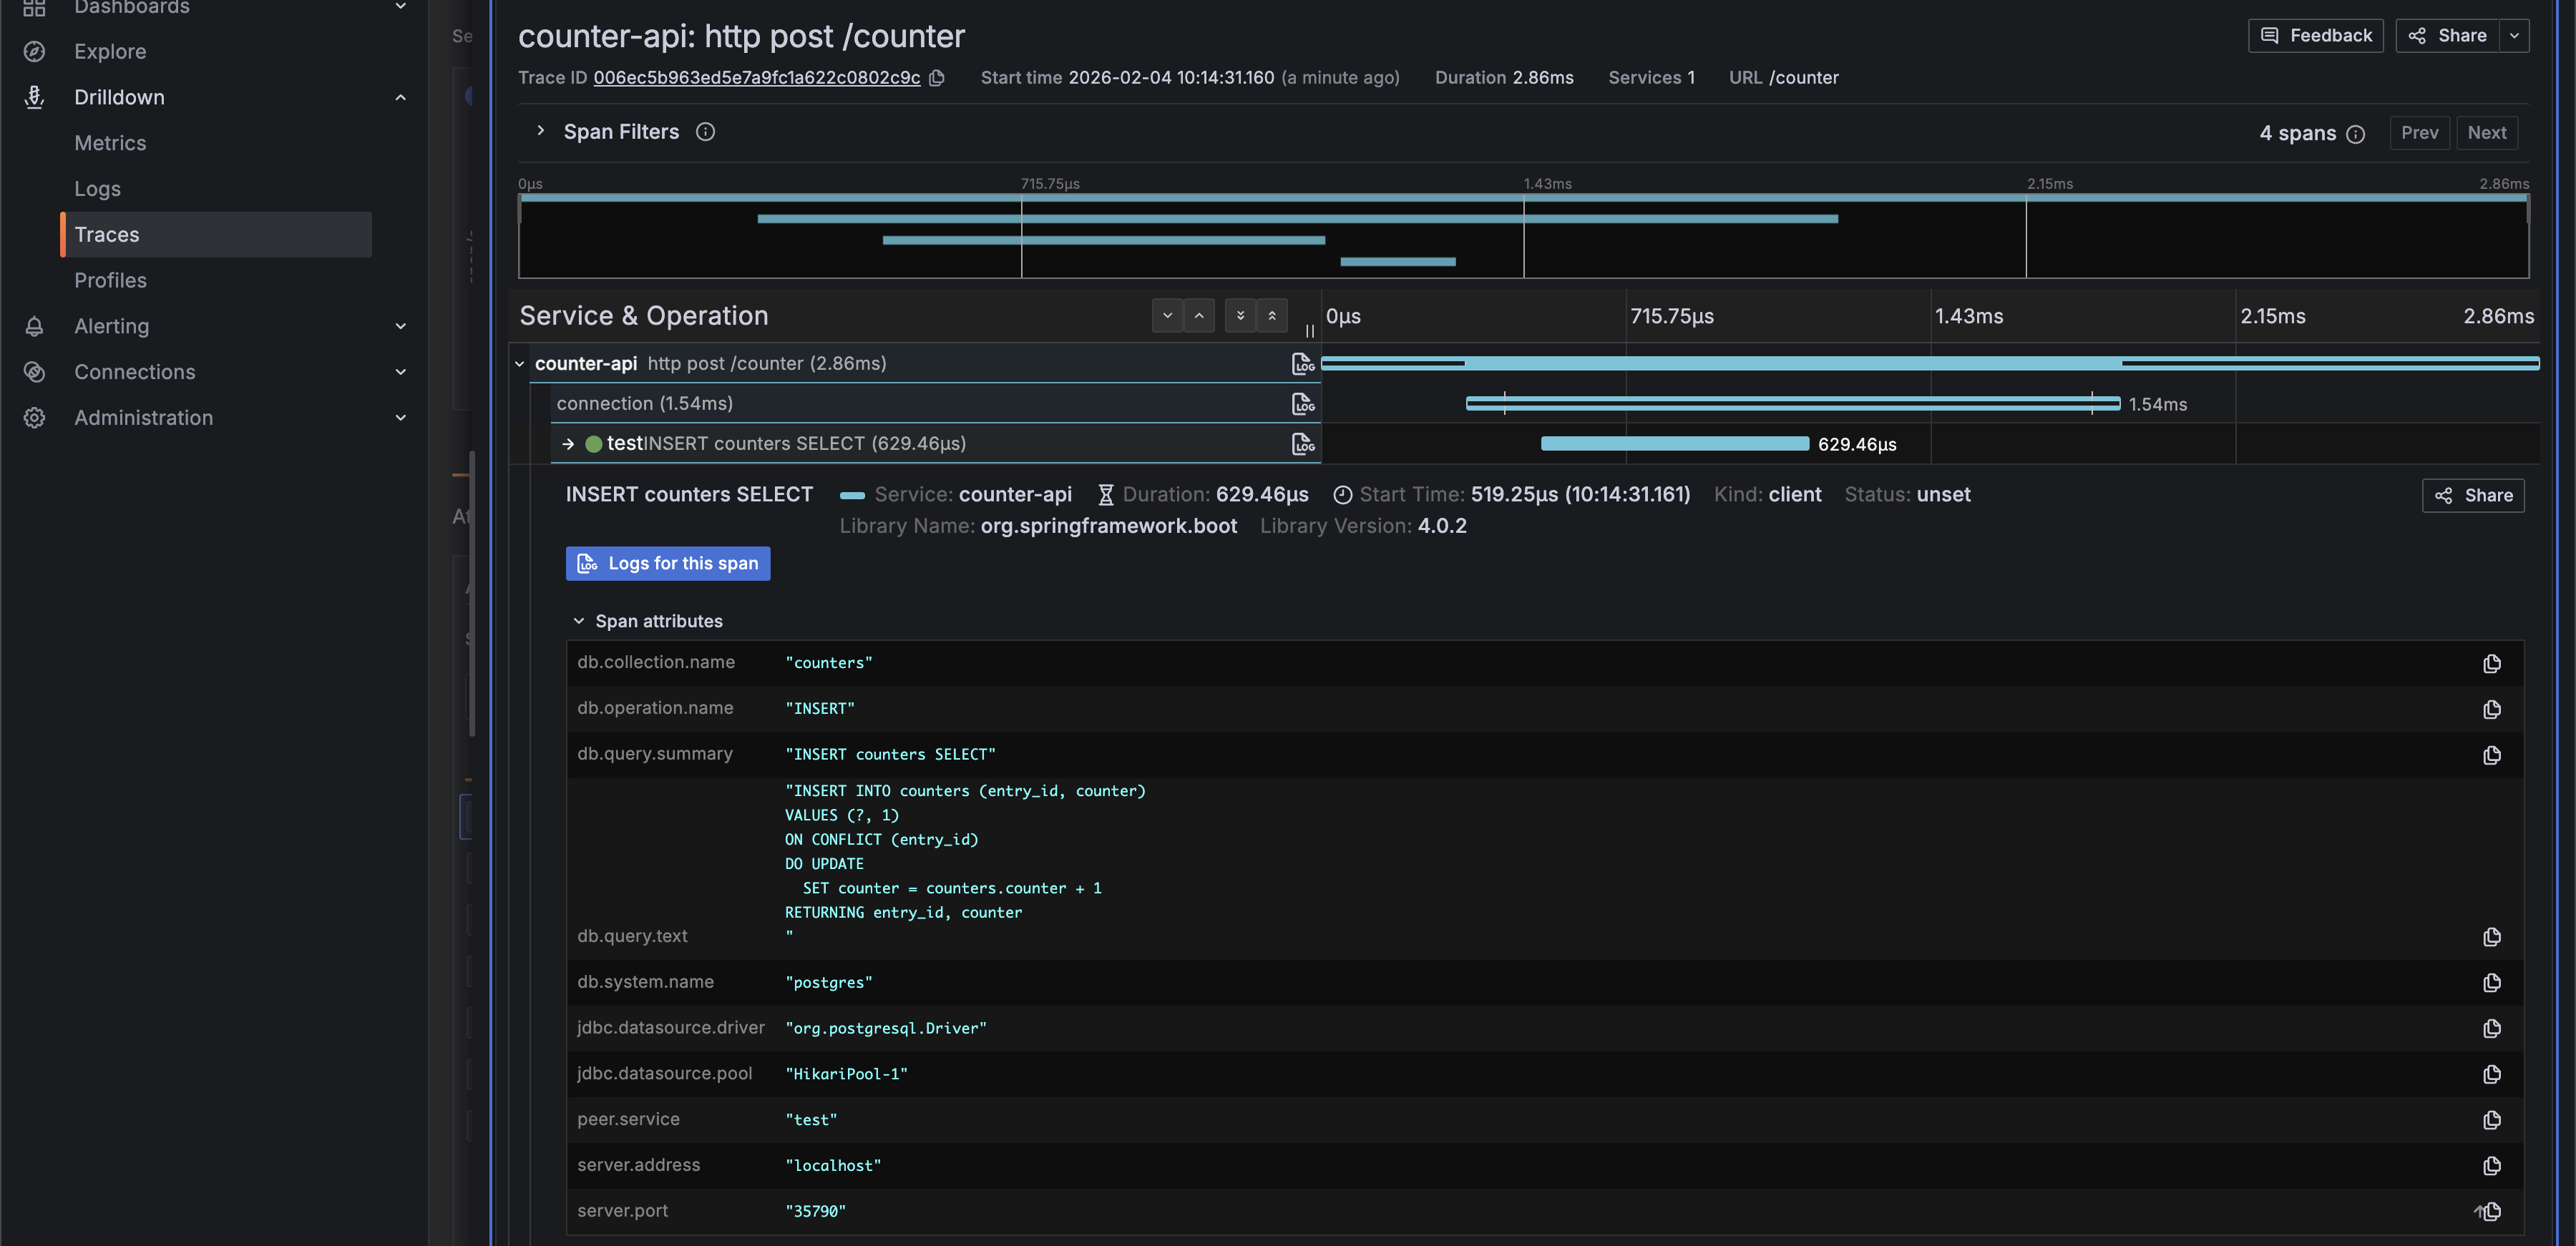
datasource-micrometer-opentelemetryが追加されることにより、Attribute名は OpenTelemetry semantic conventions に準拠するようになりました。
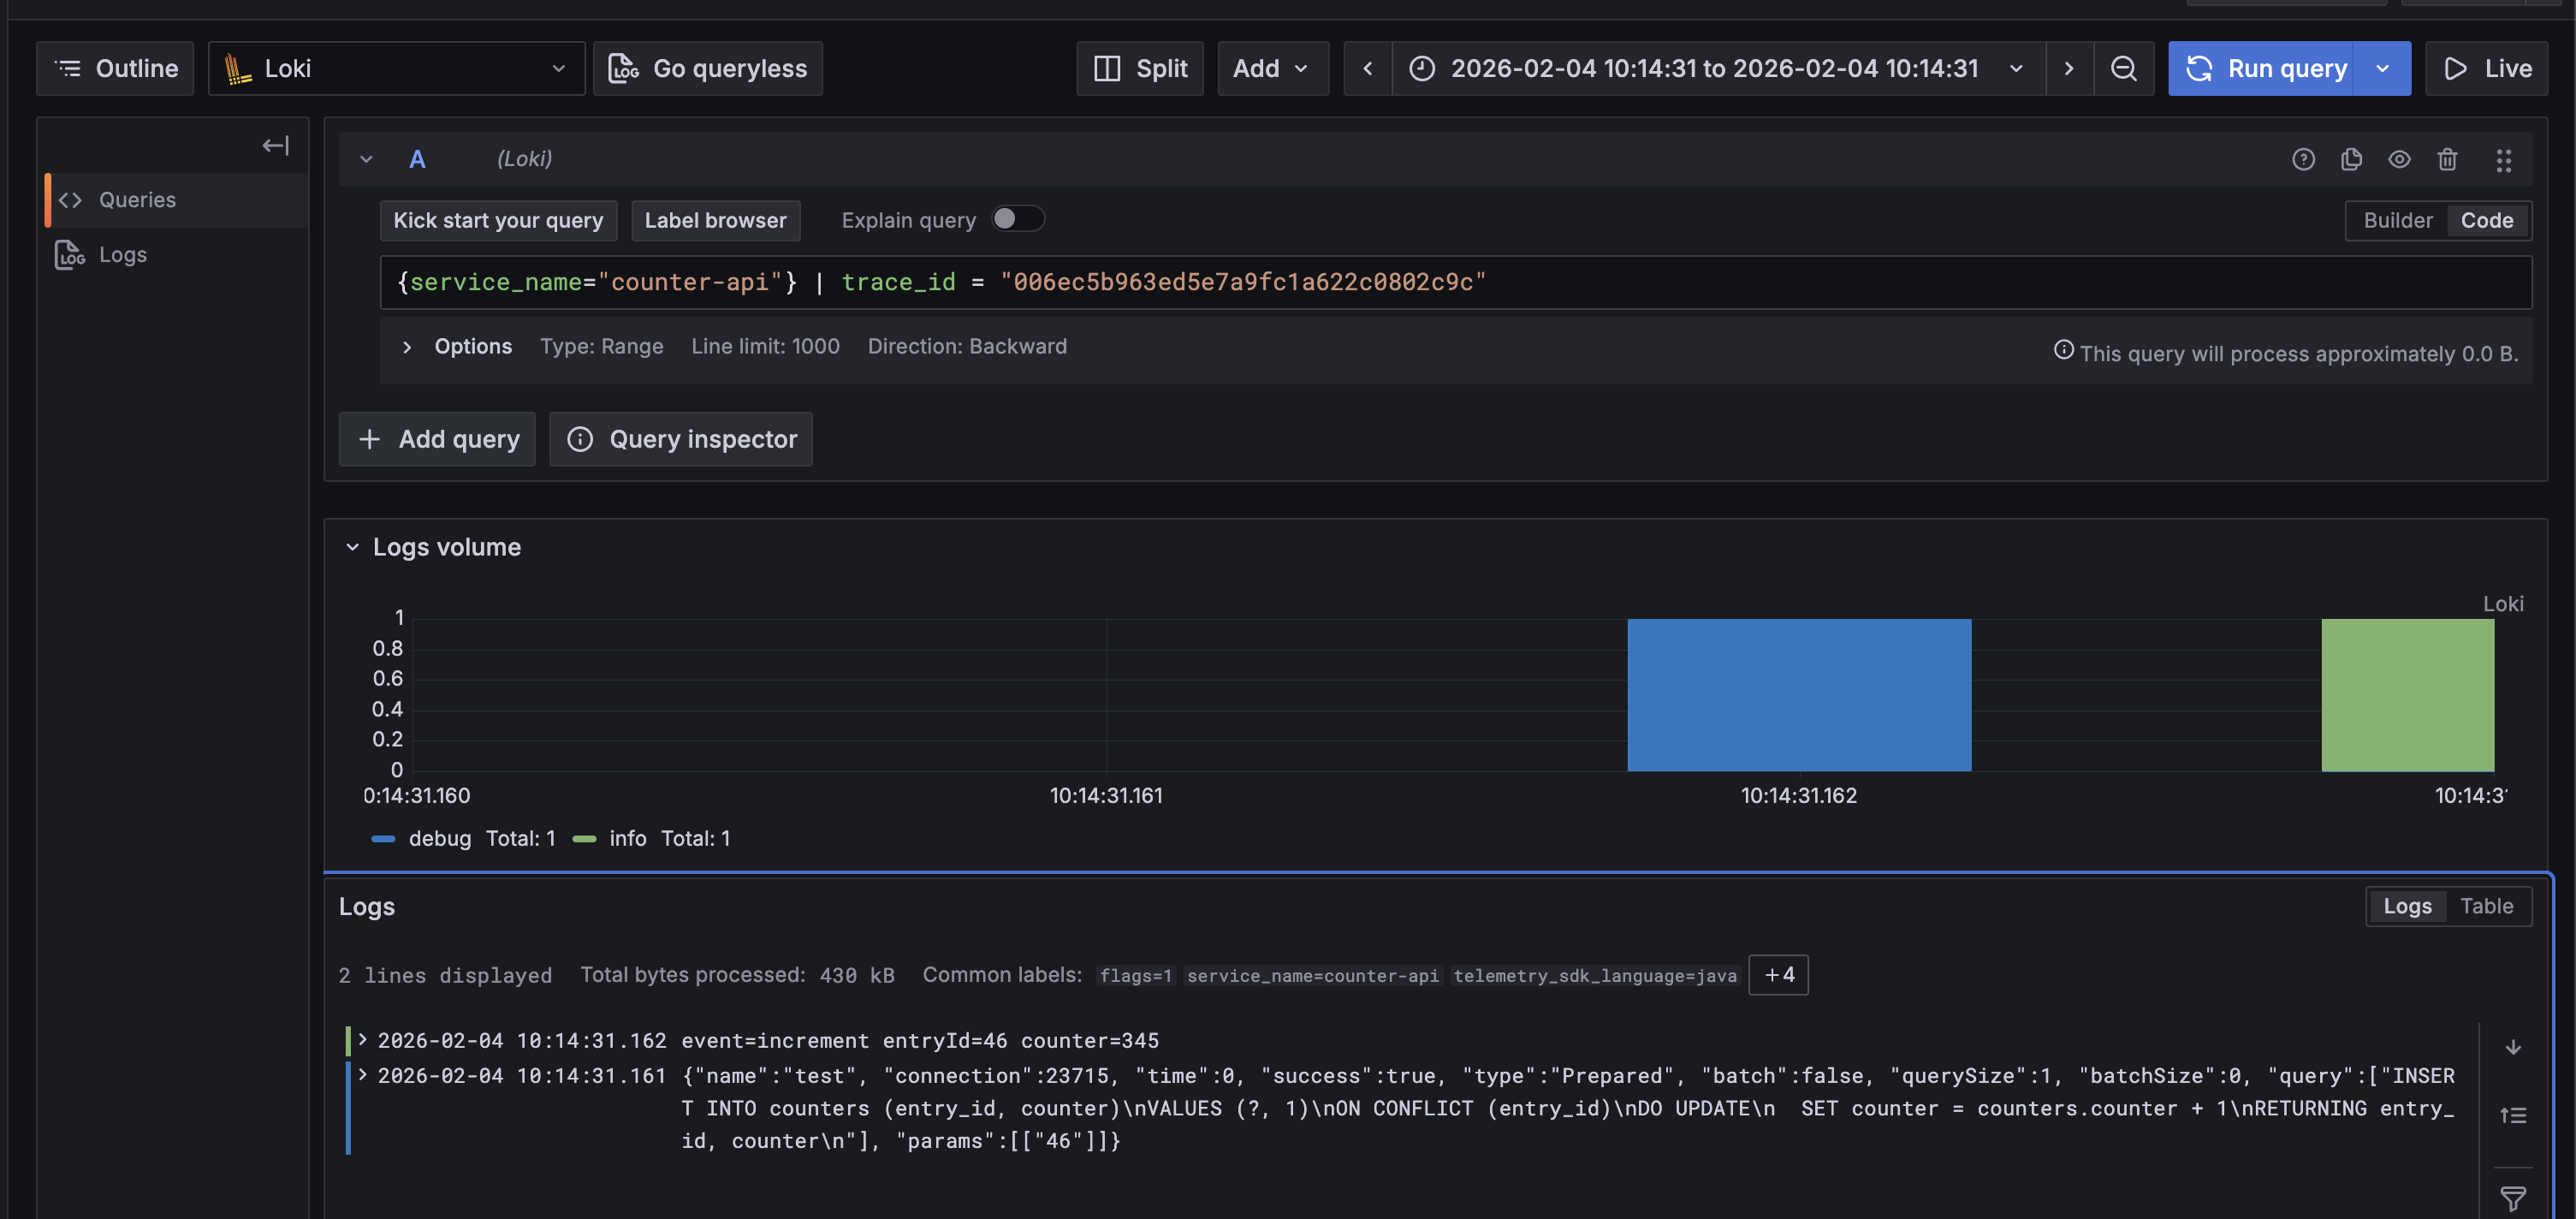
"Log" ボタンをクリックしてみます。

この Trace におけるログを確認することができます。
Metrics
次に、左のメニューの Drilldown から "Metrics" を選択します。"Prefix filters" で "jdbc" を選択すると、表示を Datasource Micrometer が送信したメトリクスのみに絞ることができます。
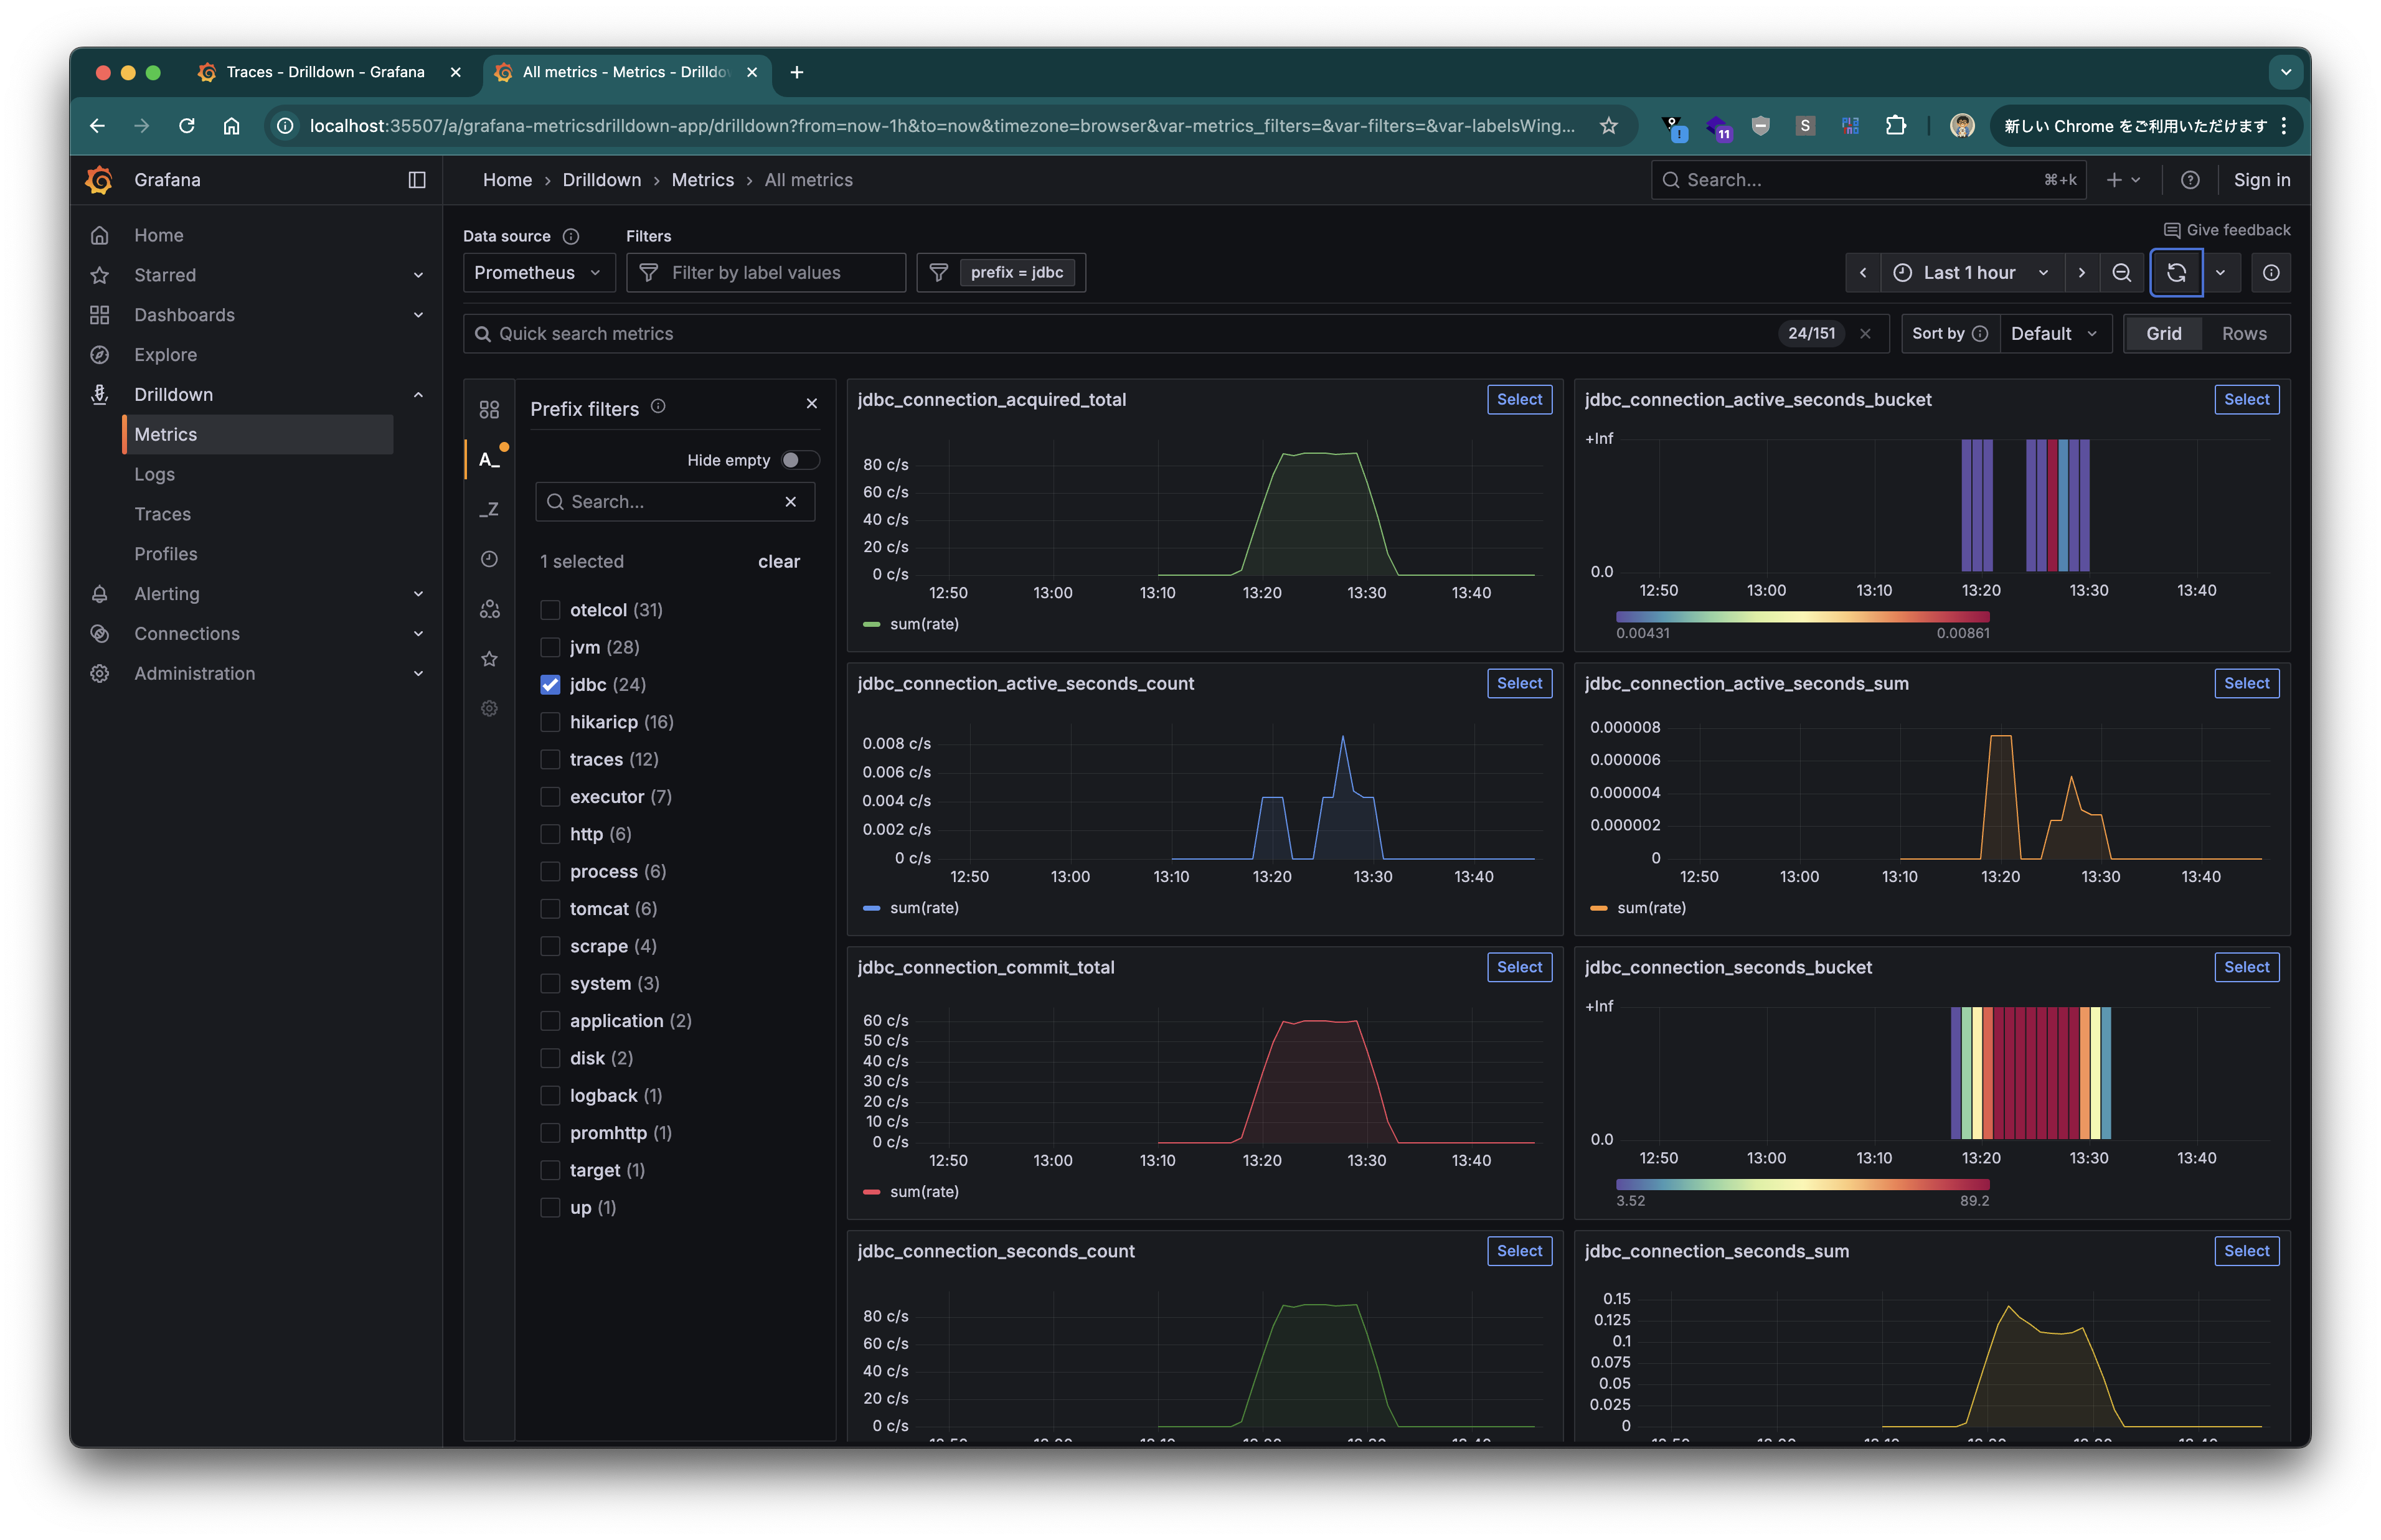
取得できるメトリクスは こちらのドキュメント を参照してください。Connection の開始から終了までの時間、コミット・ロールバックの回数、クエリの実行時間、回数などが取得できます。
Logs
最後に、左のメニューの Drilldown から "Logs" を選択します。
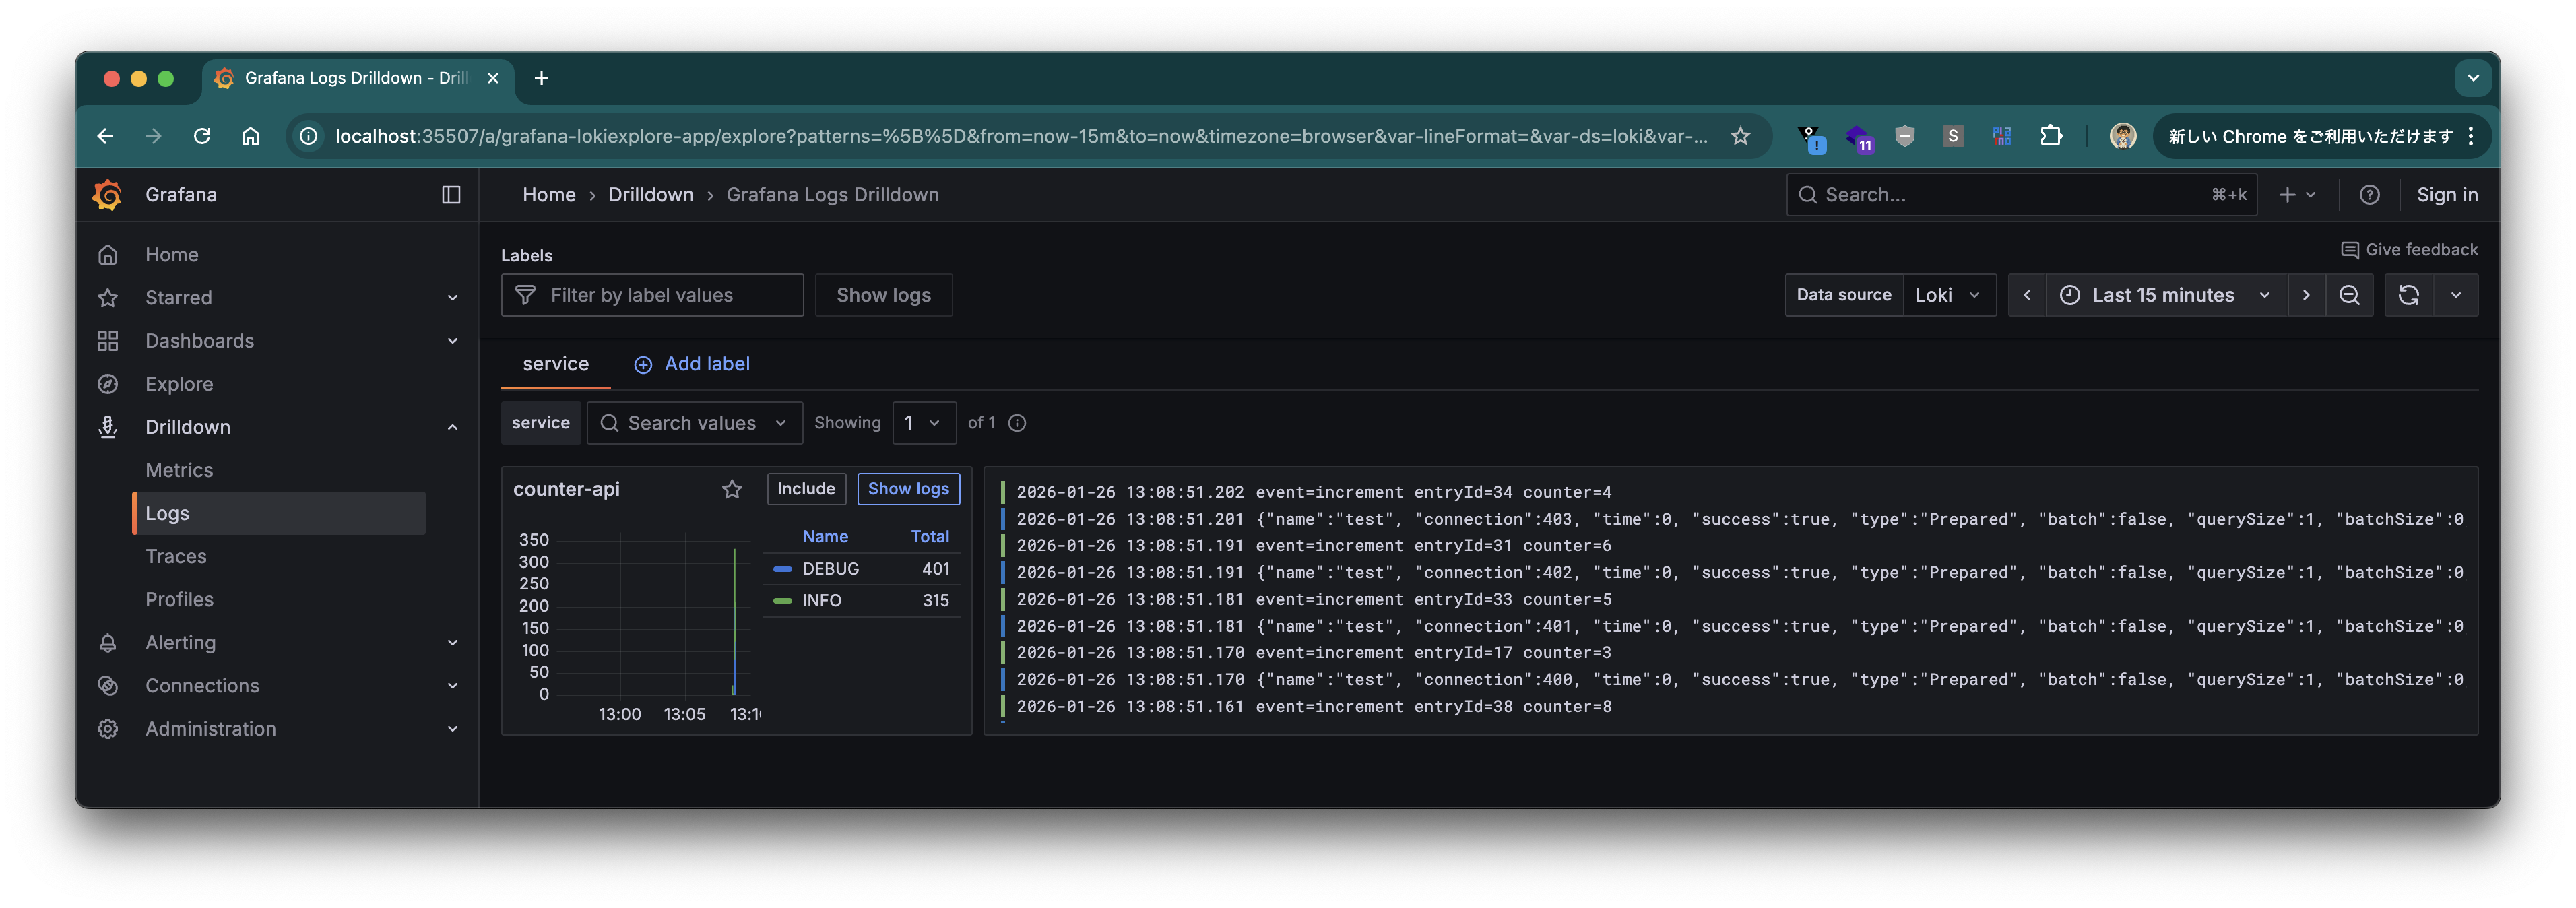
"counter-api" で "Show logs" ボタンをクリックします。
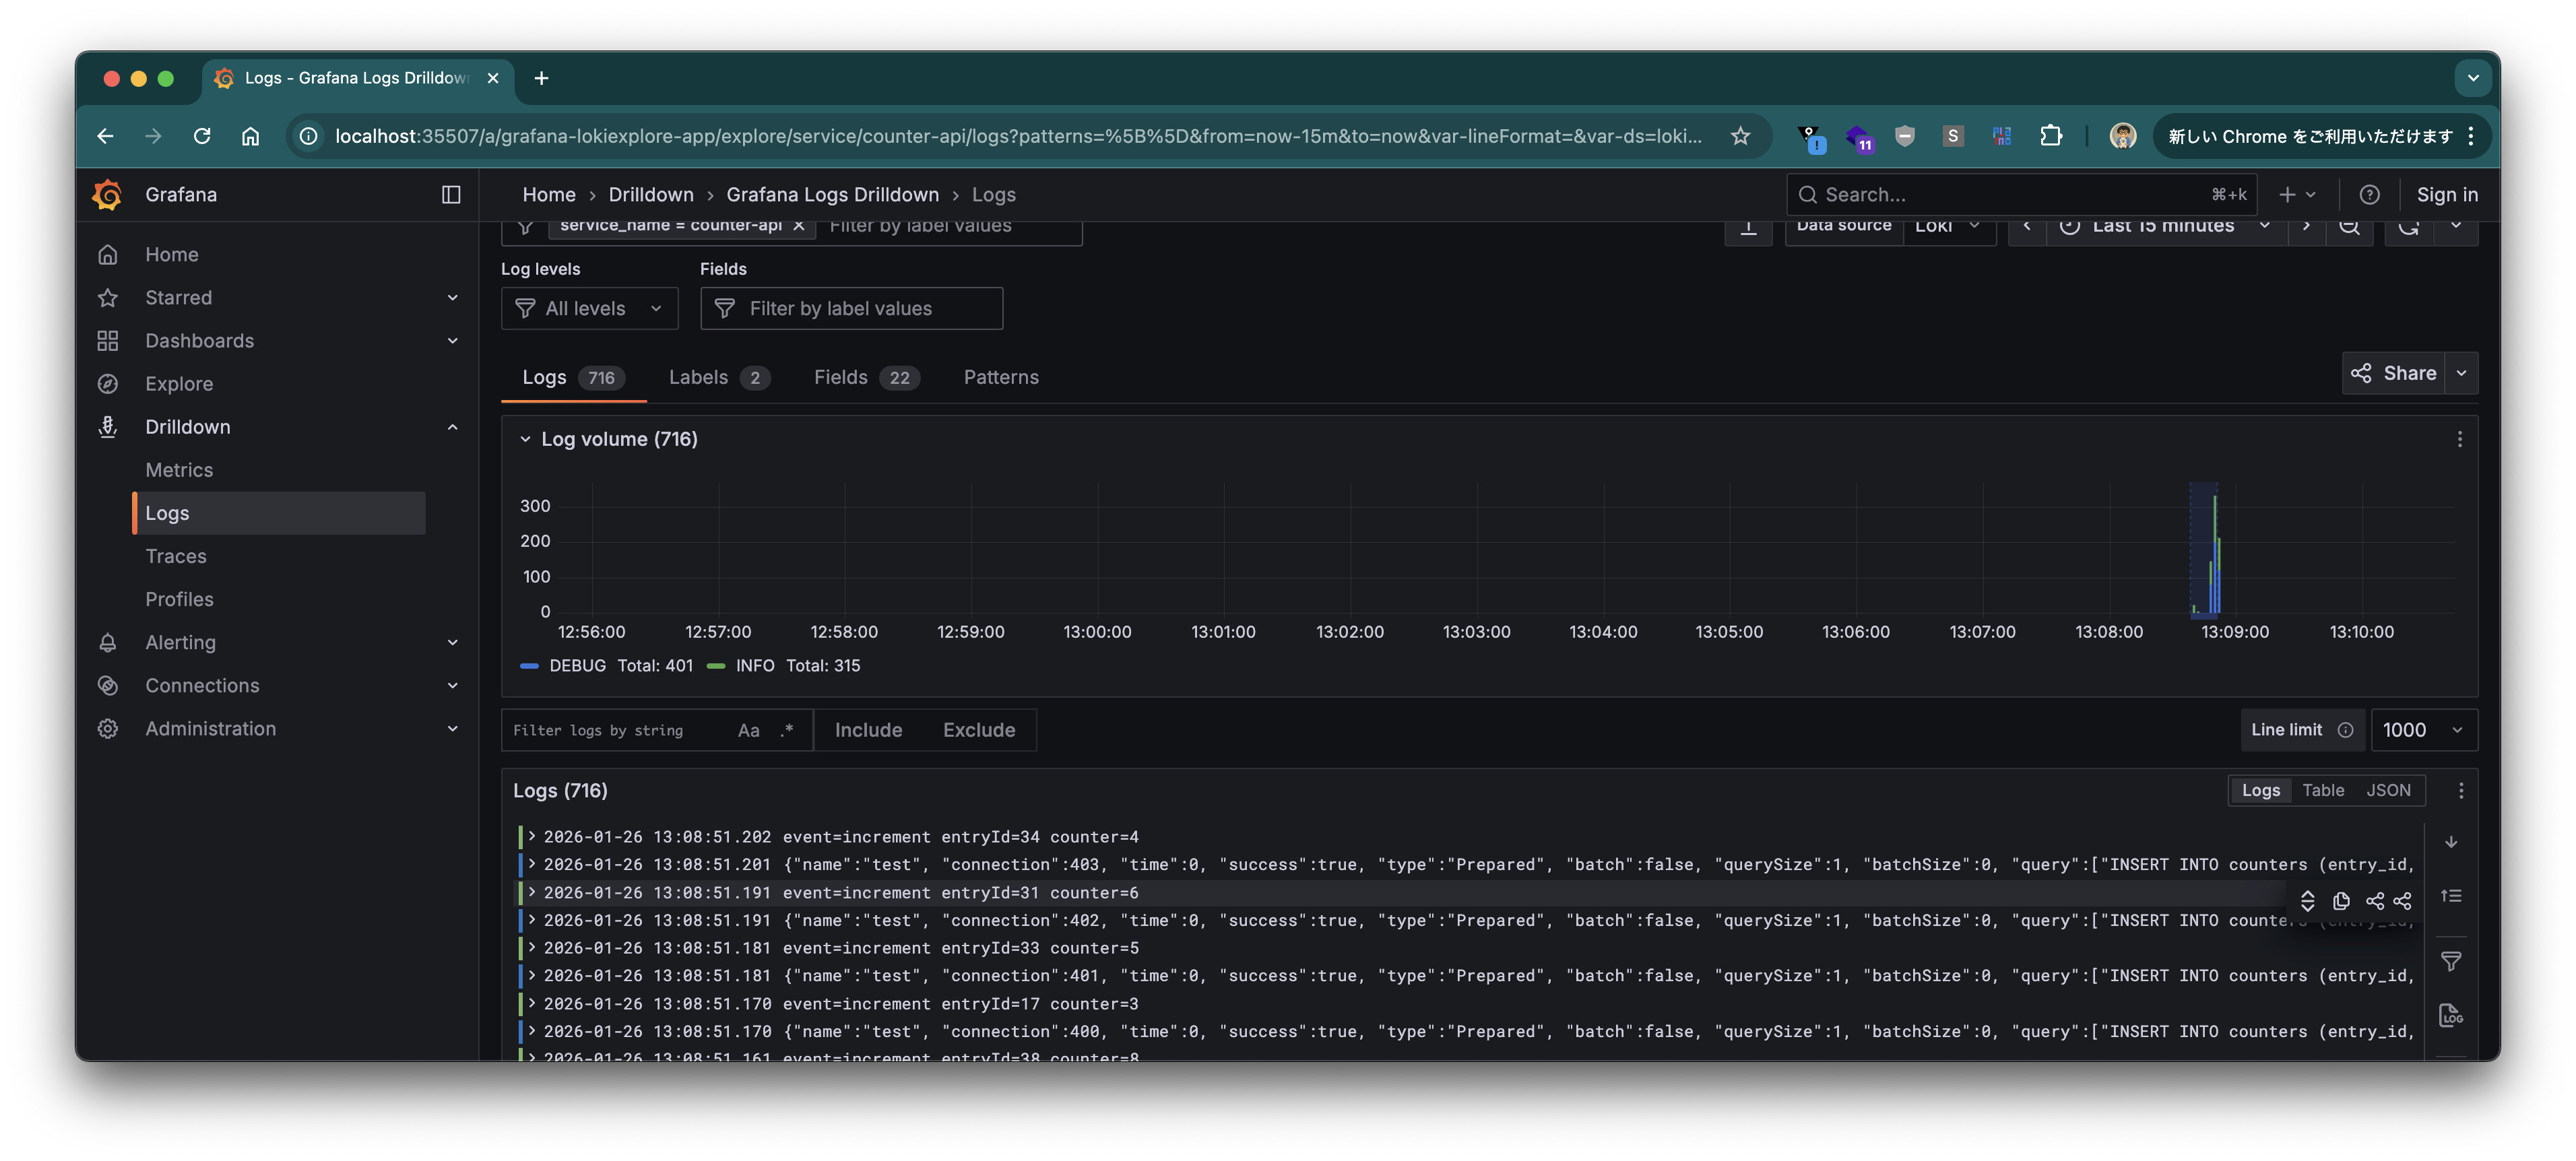
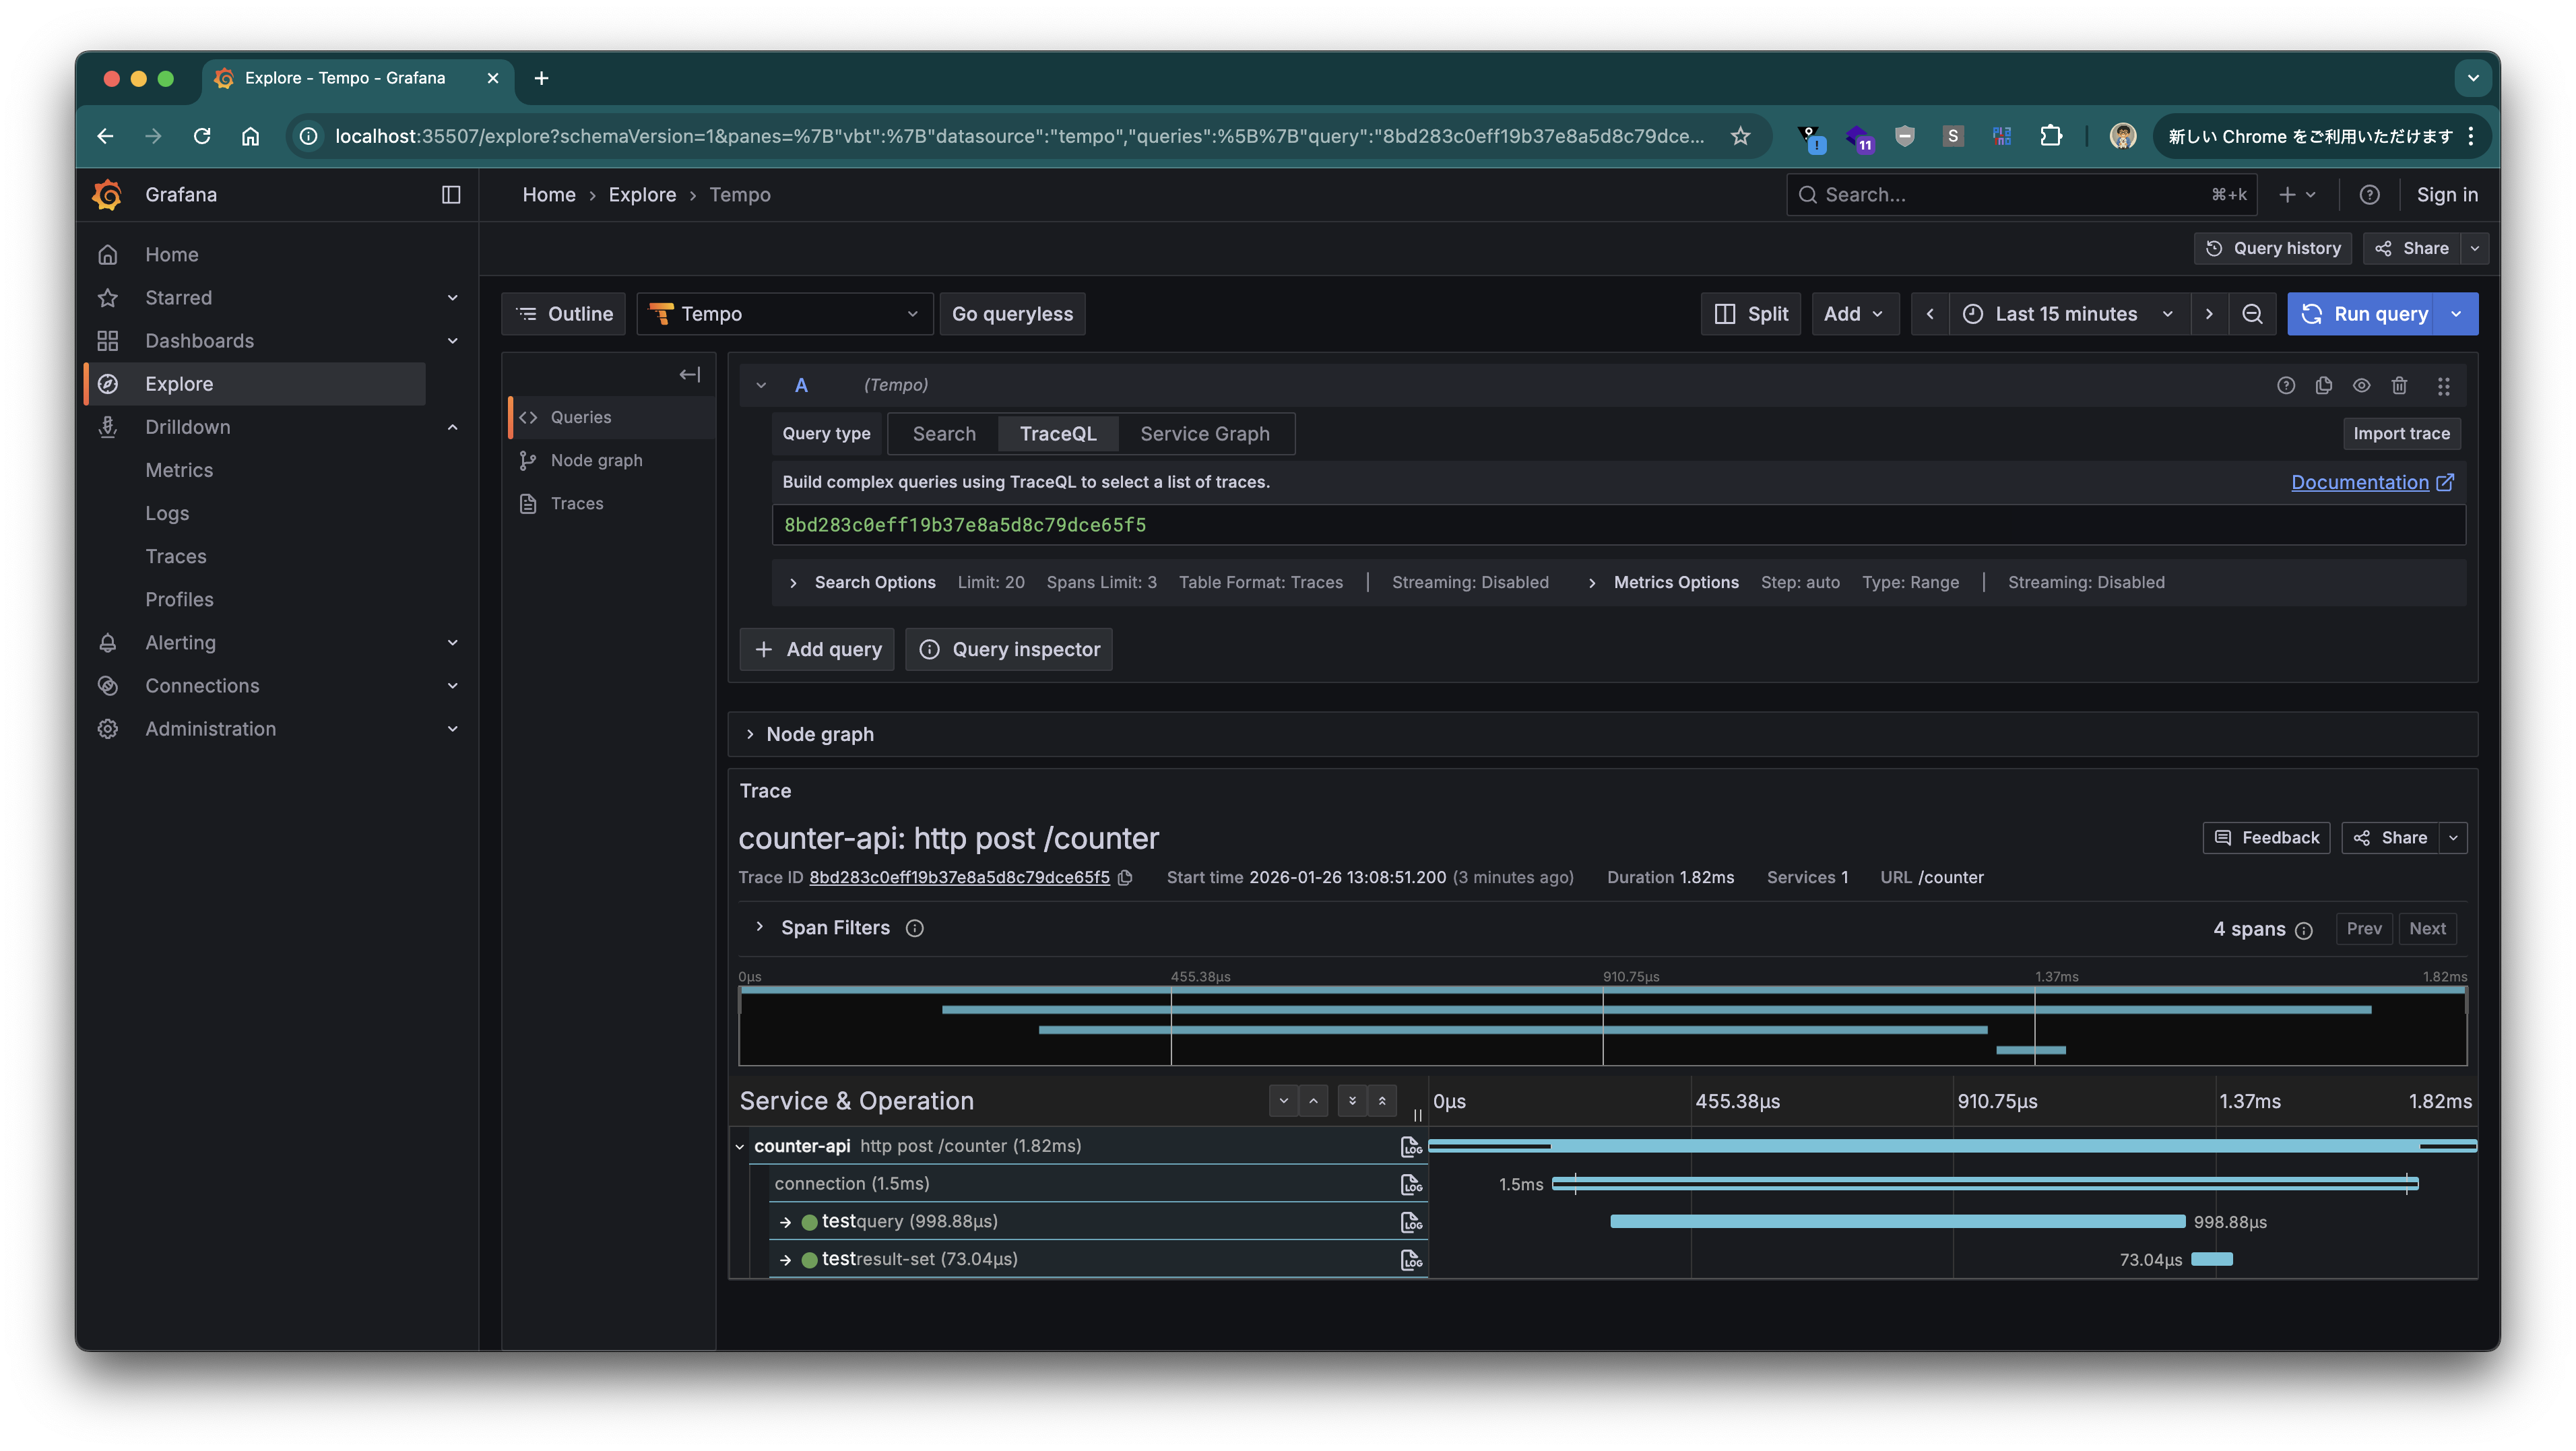
特定のログをクリックし、"Links" の "Trace" ボタンをクリックすると、
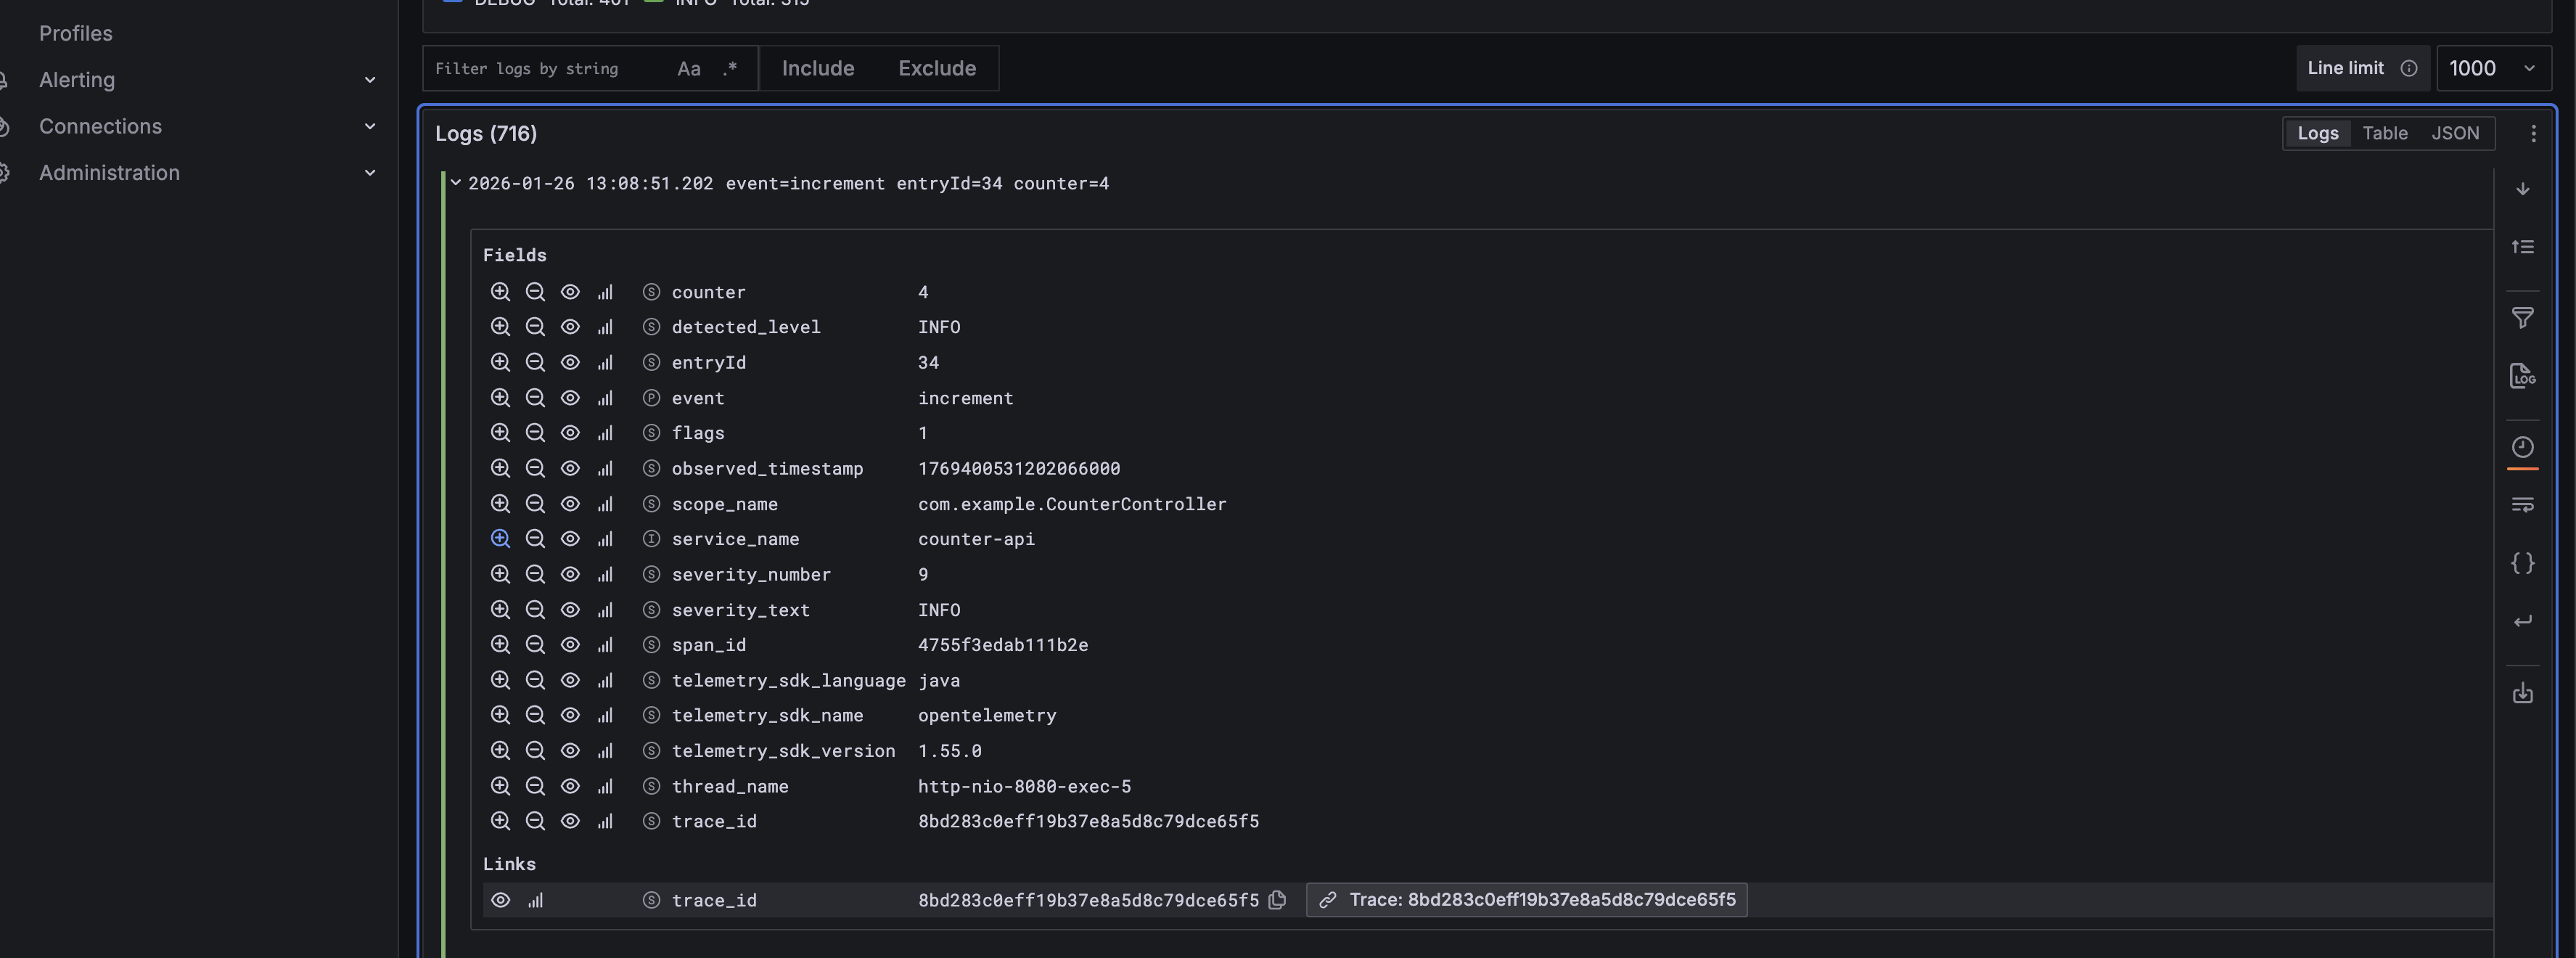
また、Trace View に飛ぶことができ、このログに関する SQL などを確認することもできます。
Datasource Micrometer を使い、Spring Boot アプリの JDBC 操作を計測する方法を紹介しました。Spring Initializr から利用できるので、簡単に組み込むことができます。ぜひ、使ってみてください。