---
title: Pivotal Web Services / Pivotal Cloud FoundryはSpring Bootのベストなプラットフォーム
tags: ["Cloud Foundry", "Pivotal Web Services", "Pivotal Cloud Foundry", "Spring Boot", "Java"]
categories: ["Programming", "Java", "org", "springframework", "boot"]
date: 2017-06-12T07:34:15Z
updated: 2017-06-27T08:03:40Z
---
**目次**
### はじめに
Cloud Foundry(特に、[Pivotal Web Services (以降、PWS)](https://run.pivotal.io)及び[Pivotal Cloud Foundry (以降、PCF)](https://docs.pivotal.io/pivotalcf/1-11/installing/pcf-docs.html))はSpring Bootアプリケーションをデプロイする先として、最適なプラットフォームになるべく機能が追加されている。
Cloud FoundryとSpring Bootの連携としては
* `cf push -p app.jar`のみでデプロイ可能
* `cloud`プロファイルの自動適用
* [Spring Cloud Connector](http://cloud.spring.io/spring-cloud-connectors/)でDBなどの接続情報設定不要化
* Spring Boot Actuatorの[Cloud Foundry向けEndpoint](http://docs.spring.io/spring-boot/docs/1.5.4.RELEASE/reference/html/production-ready-cloudfoundry.html)
* Apps Manager(アプリケーション管理UI)の[Spring Boot Actuator連携](http://docs.pivotal.io/pivotalcf/console/using-actuators.html) (**PWS, PCFのみ**)
* GoRouterによるZipkin Headerの付与
* Hosted Zipkinとして使える[PCF Metrics](https://docs.pivotal.io/pcf-metrics)の[Trace Explorer](https://docs.pivotal.io/pcf-metrics/1-3/using.html#trace) (**PWS, PCFのみ**)
* Managed Config Server, Eureka Server, Hystrix Dashboardを提供する[Spring Cloud Services](http://docs.pivotal.io/spring-cloud-services) (**PWS, PCFのみ**)
が挙げられるが、特にわかりやすく便利なのがApps ManagerのSpring Boot Actuator連携。以前にも[紹介](https://blog.ik.am/entries/401)したが、PCF 1.11でUIが変わりさらに機能が加わるので改めて紹介する。PWSではすでに[利用可能](http://docs.run.pivotal.io/console/using-actuators.html)になっている。
### Apps ManagerにサポートされているActuatorエンドポイント
Spring Boot Actuatorには現状、デフォルトで次のエンドポイントが利用可能である。Apps Managerがサポートしているエンドポイントにマークを入れた。
| Path | Short Description | Apps Manager Support |
| --- | --- | --- |
| `/auditevents ` | 認証の成功失敗に関する監査ログを表示 | |
| `/autoconfig` | AutoConfigurationのうち、有効になっているもの、なっていないものを列挙 | |
| `/beans ` | Springに管理されているBean一覧を表示 | |
| `/configprops` | `@ConfigurationProperties`のついたBeanに実際に設定されている値を表示 | |
| `/dump` | スレッドダンプを表示 | 🆕 |
| `/env` | 環境変数や設定されたプロパティを表示 | |
| `/health` | データベースなどのヘルスチェック結果を表示 | ✅ |
| `/info` | アプリケーションの情報を表示 | ✅ |
| `/loggers` | ログレベルの表示及び変更 | ✅ |
| `/metrics` | アプリケーションのメトリクスを表示 | |
| `/mappings ` | `@RequestMapping`で定義されているパスとContollerメソッドのマッピング一覧を表示 | |
| `/trace` | リクエストのトレースログを表示 | 🆕 |
| `/heapdump` | GZipで圧縮された`hprof`のheapdumpファイルをダウンロード | 🆕 |
✅がついているものが前回紹介した時からApps Managerがサポートしていた機能で、🆕がついているものがPCF 1.11で追加されるもの(PWSではすでに利用可能)。
Actuator連携の嬉しい点は**認可対策が自動で行われる**点。
Spring Boot 1.5からActuatorのエンドポイントがデフォルトで認可制御されるようになった。Actuatorは機密情報を含む場合があるため、基本的にセキュリティの設定が必須であるが、PWS / PCFにデプロイした場合は、認可設定をしたままでもApps Manager上からはアクセスできるので、開発者がケアしないといけない点が減る。
> Memo:
>
> ちなみに、`/health`と`/info`エンドポイントはデフォルトで、誰でもアクセスできるようになっている。
> ただし、`/health`に関しては、認可されてない場合は個別サービスのヘルスチェック結果は表示されず、全てを総合して`UP`か`DOWN`かだけ返す。
>
>  ### プロジェクトの設定
普通のSpring Bootプロジェクトを[Spring Initializr](https://start.spring.io)から作成すればいいが、Acutator連携を試したいので、`spring-boot-start-actuator`が必要。また、対応するSpring Bootのバージョンは1.5以上。
``` xml
org.springframework.boot
spring-boot-starter-actuator
```
infoエンドポイントにアプリケーションのバージョン情報を出力させたい場合は、次のように`spring-boot-maven-plugin`に`build-info`goalを追加する必要がある。
``` xml
org.springframework.boot
spring-boot-maven-plugin
build-info
```
また、infoエンドポントにGitのメタ情報を出力させたい場合は、次のように
``` xml
pl.project13.maven
git-commit-id-plugin
```
さらに、Git情報にremoteのurlなど詳細な情報を含めたい場合は`application.properties`に次の設定が必要である。
```
management.info.git.mode=full
```
以上の設定は特にApps Manager連携に特化したものではない。
> Memo:
>
> 自己証明書使ったPivotal Cloud Foundryの場合、`application.properties`に次の設定も必要。
>
> ```
> management.cloudfoundry.skip-ssl-validation=true
> ```
### アプリケーションのデプロイ
Pivotal Web Servicesを使う場合は、アカウントを作成して
```
$ cf login -a api.run.pivotal.io
```
でログイン。
```
$ ./mvnw clean package -DskipTests=true
```
で
```
$ cf push your-app-name -p target/you-app-name-0.0.1-SNAPSHOT.jar
```
でデプロイ完了。
### プロジェクトの設定
普通のSpring Bootプロジェクトを[Spring Initializr](https://start.spring.io)から作成すればいいが、Acutator連携を試したいので、`spring-boot-start-actuator`が必要。また、対応するSpring Bootのバージョンは1.5以上。
``` xml
org.springframework.boot
spring-boot-starter-actuator
```
infoエンドポイントにアプリケーションのバージョン情報を出力させたい場合は、次のように`spring-boot-maven-plugin`に`build-info`goalを追加する必要がある。
``` xml
org.springframework.boot
spring-boot-maven-plugin
build-info
```
また、infoエンドポントにGitのメタ情報を出力させたい場合は、次のように
``` xml
pl.project13.maven
git-commit-id-plugin
```
さらに、Git情報にremoteのurlなど詳細な情報を含めたい場合は`application.properties`に次の設定が必要である。
```
management.info.git.mode=full
```
以上の設定は特にApps Manager連携に特化したものではない。
> Memo:
>
> 自己証明書使ったPivotal Cloud Foundryの場合、`application.properties`に次の設定も必要。
>
> ```
> management.cloudfoundry.skip-ssl-validation=true
> ```
### アプリケーションのデプロイ
Pivotal Web Servicesを使う場合は、アカウントを作成して
```
$ cf login -a api.run.pivotal.io
```
でログイン。
```
$ ./mvnw clean package -DskipTests=true
```
で
```
$ cf push your-app-name -p target/you-app-name-0.0.1-SNAPSHOT.jar
```
でデプロイ完了。
 [Apps Manager](https://console.run.pivotal.io)にログインして、デプロイしたアプリケーションを開き、左上にSpring Bootマークが出ていたらAcutaotr連携成功。
### healthエンドポイント
一番わかりやすいhealthエンドポイントから。Apps Managerの「Instances」を開くと、`/health`エンドポイントの結果が出力される。(この例ではMySQLとRabbitMQに接続している)
[Apps Manager](https://console.run.pivotal.io)にログインして、デプロイしたアプリケーションを開き、左上にSpring Bootマークが出ていたらAcutaotr連携成功。
### healthエンドポイント
一番わかりやすいhealthエンドポイントから。Apps Managerの「Instances」を開くと、`/health`エンドポイントの結果が出力される。(この例ではMySQLとRabbitMQに接続している)
 どこかに障害が発生していると赤文字で**DOWN**が表示される。
「View JSON」をクリックすると、JSONの出力結果がそのまま表示される。
どこかに障害が発生していると赤文字で**DOWN**が表示される。
「View JSON」をクリックすると、JSONの出力結果がそのまま表示される。
 ```
$ cf scale your-app-name -i 2
```
でスケールアウトしても、各インスタンスの情報がそれぞれ出力されてGood。
```
$ cf scale your-app-name -i 2
```
でスケールアウトしても、各インスタンスの情報がそれぞれ出力されてGood。
 連携サービスが多くなれば多くなるほどこの機能は重宝する。
### infoエンドポイント
infoエンドポイントの情報は「Settings」タブの真ん中あたりの「Spring Info」に表示される。
Gitのコミット情報が表示されている。
連携サービスが多くなれば多くなるほどこの機能は重宝する。
### infoエンドポイント
infoエンドポイントの情報は「Settings」タブの真ん中あたりの「Spring Info」に表示される。
Gitのコミット情報が表示されている。
 SHAハッシュのリンクをクリックすればRemote先(Githubなど)のコミットログに飛べる。
 地味だけど、右上にもコミットのリンクが表示されている。

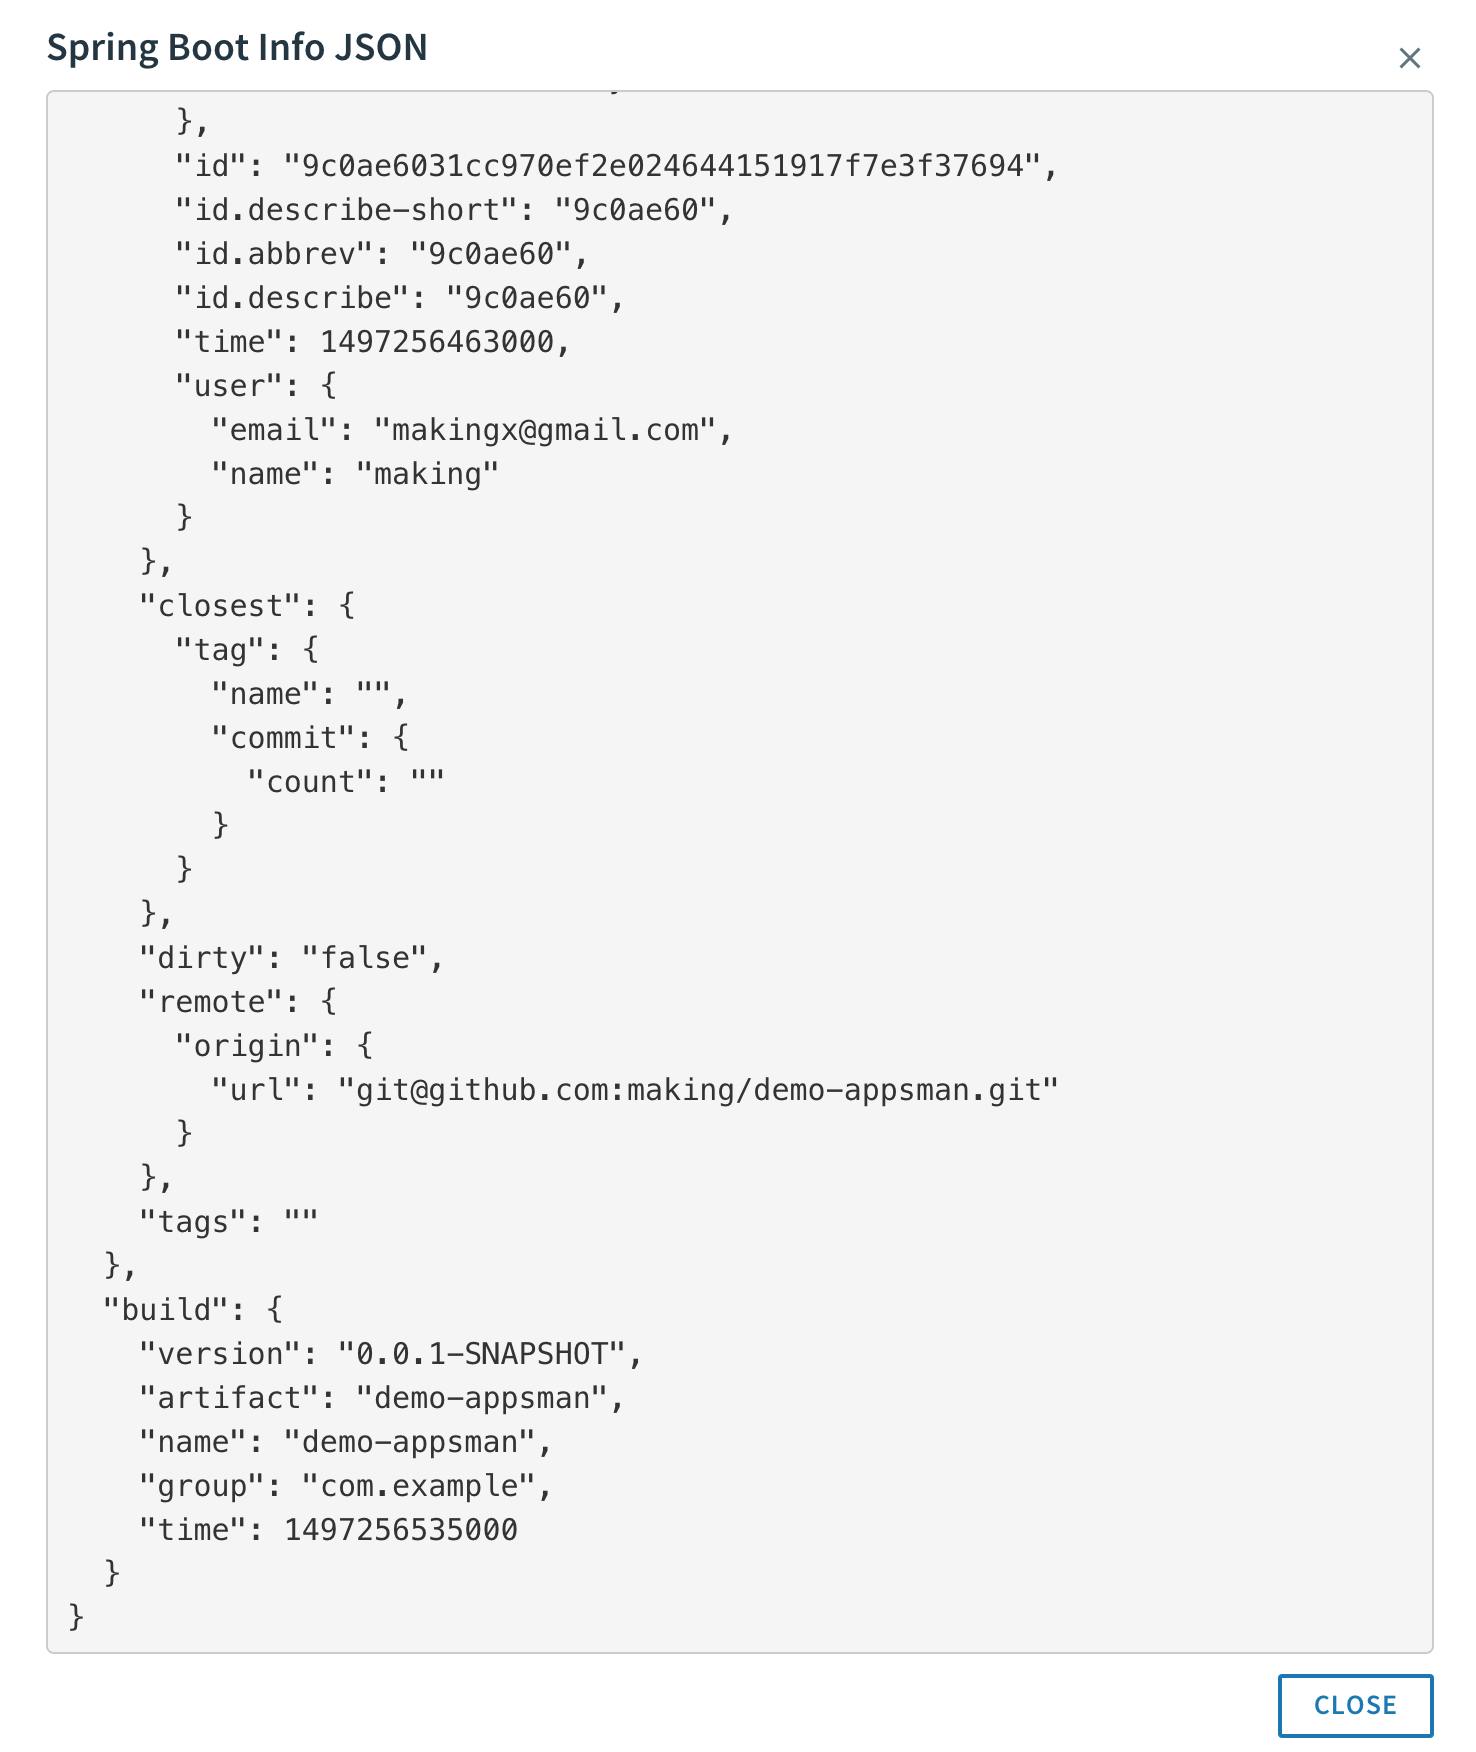
「VIEW RAW JSON」をクリックすれば`/info`のJSONの出力結果がそのまま表示される。アプリケーションのバージョンはここから確認できる。
地味だけど、右上にもコミットのリンクが表示されている。

「VIEW RAW JSON」をクリックすれば`/info`のJSONの出力結果がそのまま表示される。アプリケーションのバージョンはここから確認できる。
 ### loggersエンドポイント
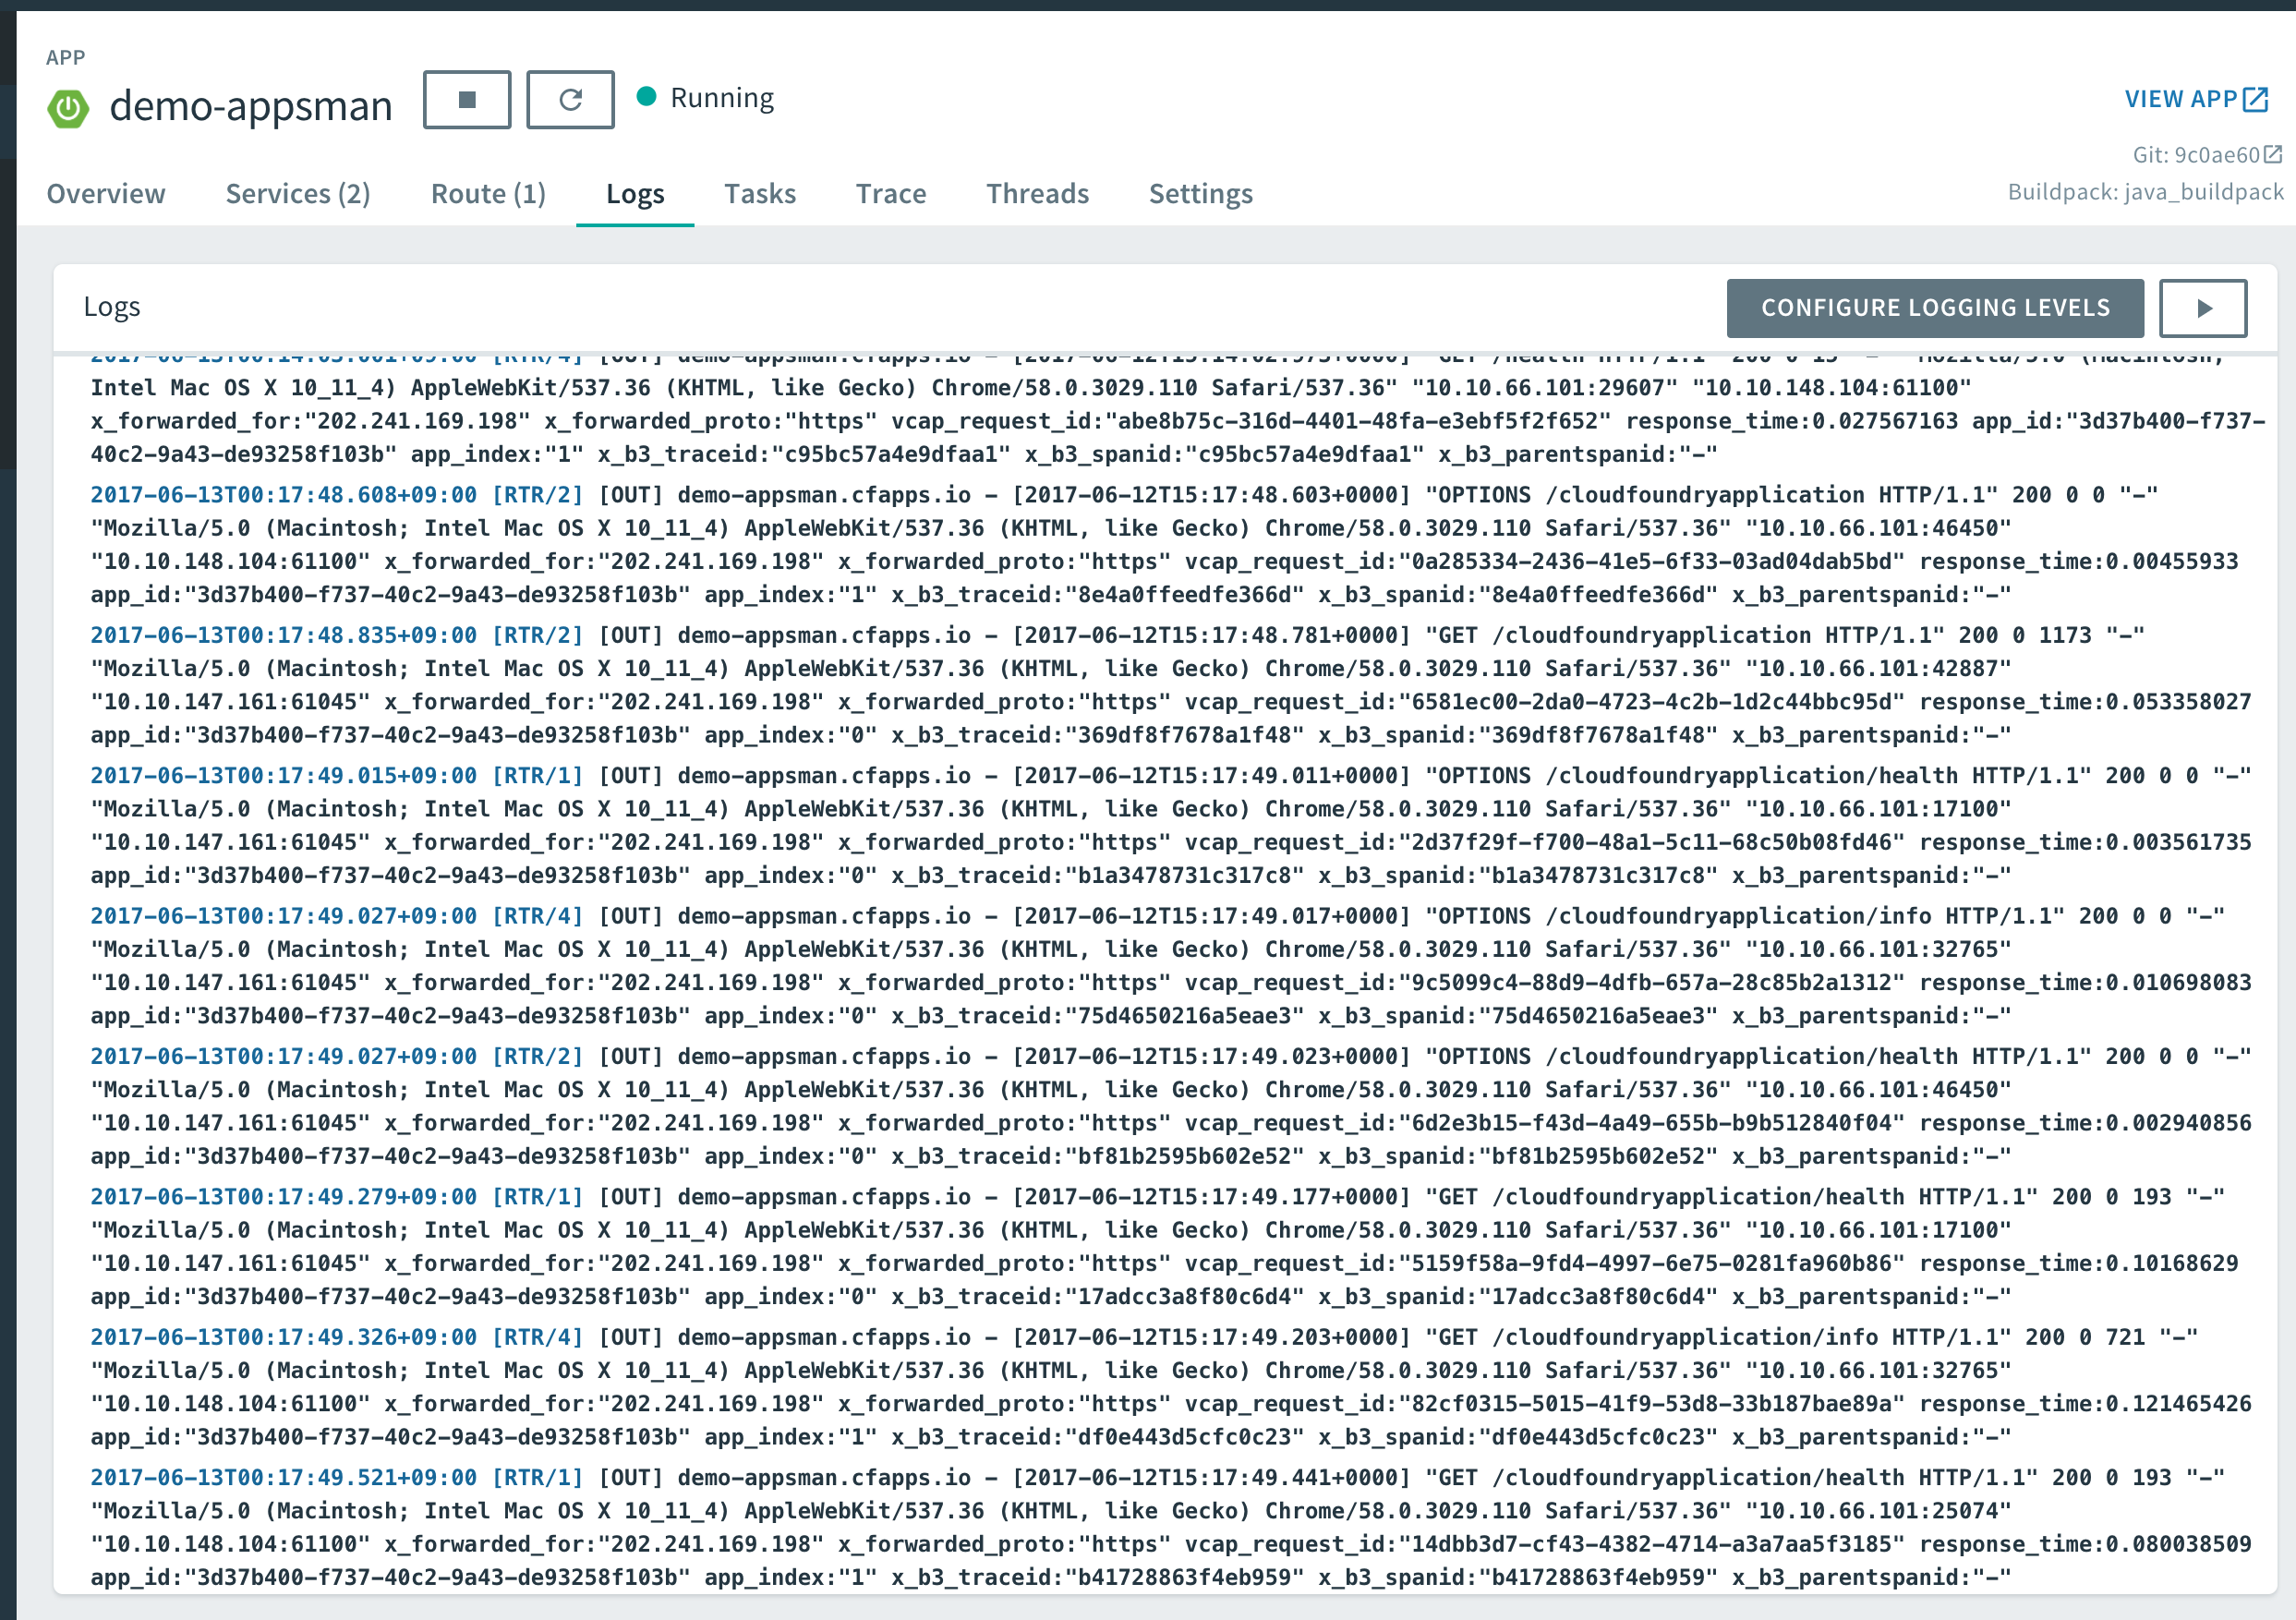
「Logs」タブを見ると「CONFIGURE LOGGING LEVELS」ボタンが見える。
### loggersエンドポイント
「Logs」タブを見ると「CONFIGURE LOGGING LEVELS」ボタンが見える。
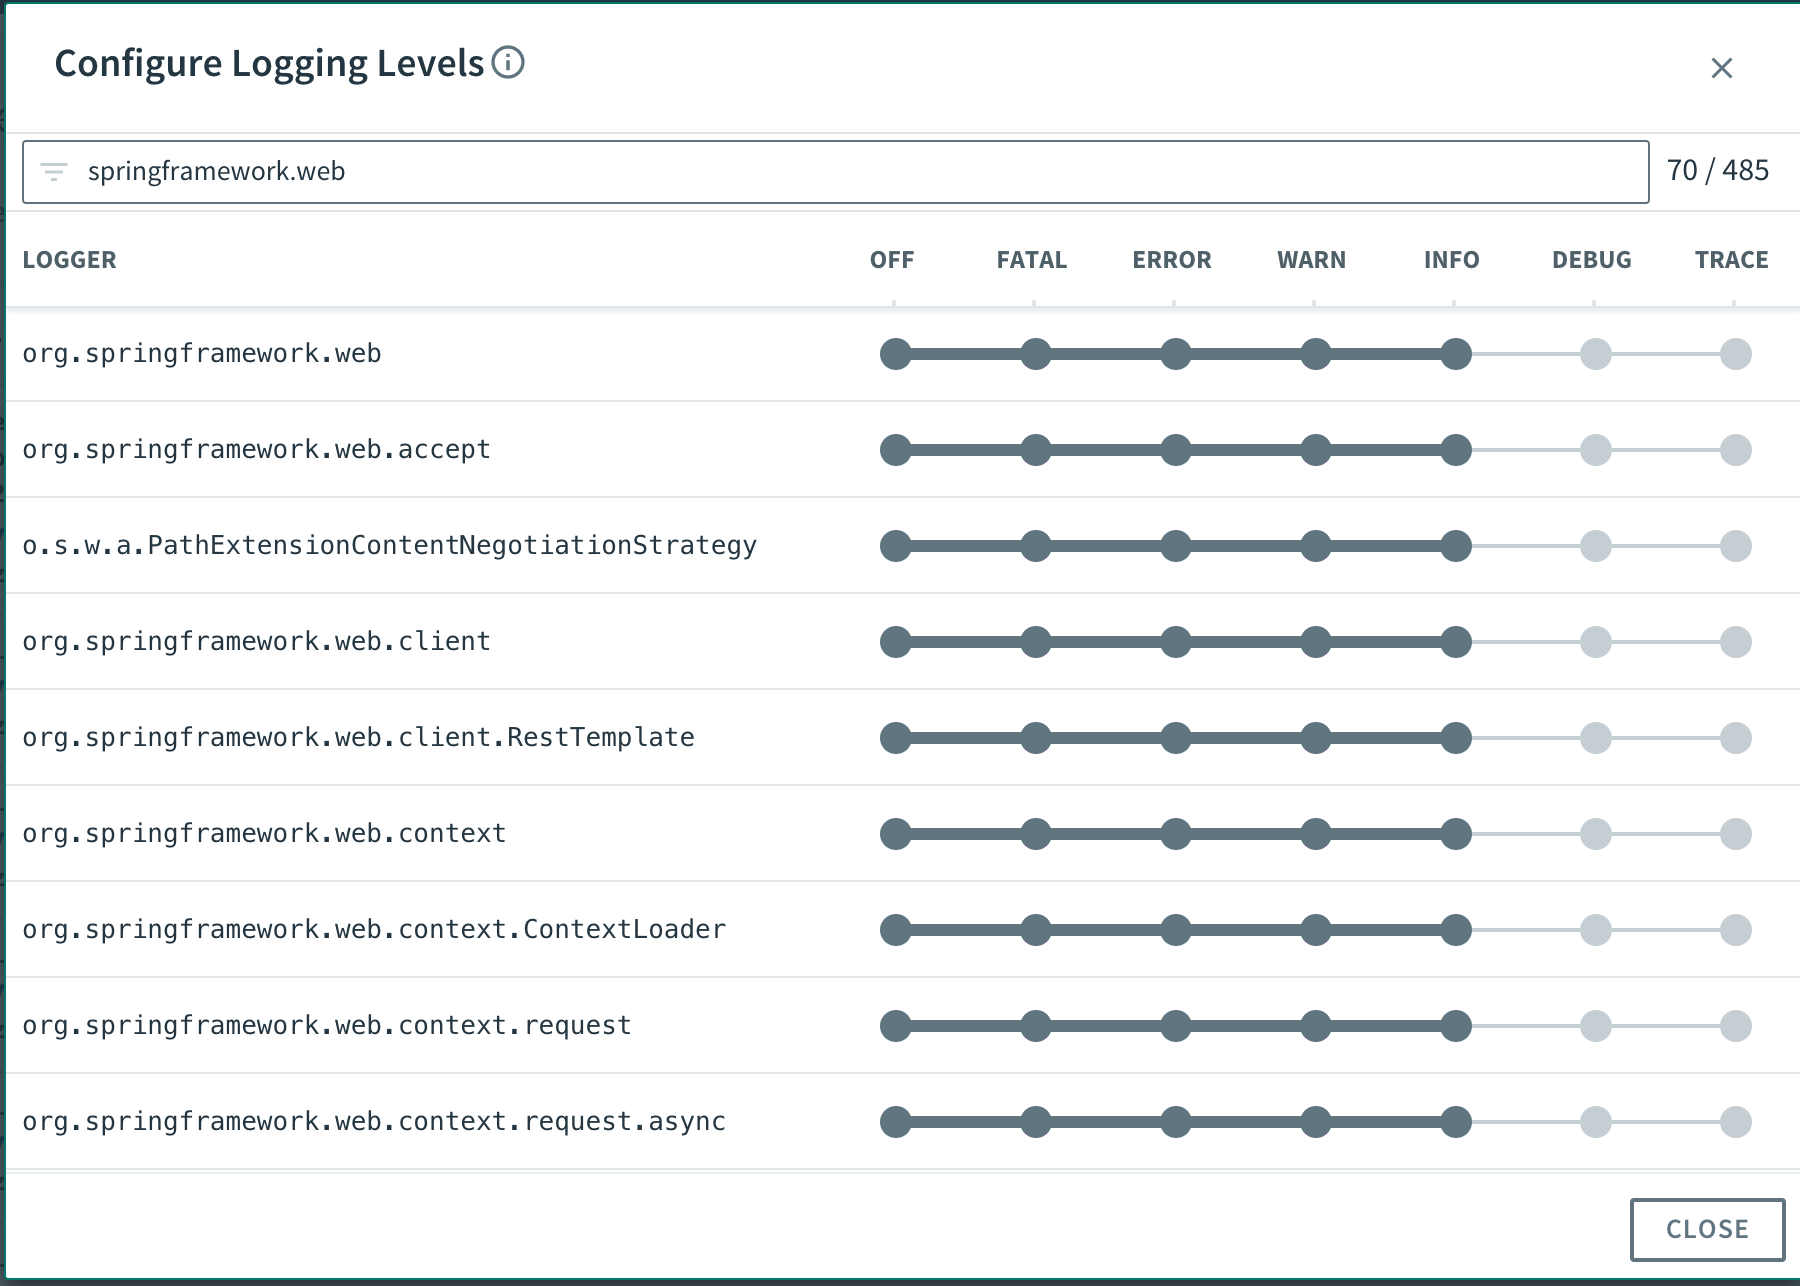
 このボタンを押すとログレベル変更ダイアログが出てくる。
 変更したいロガーをFilterに入力し、
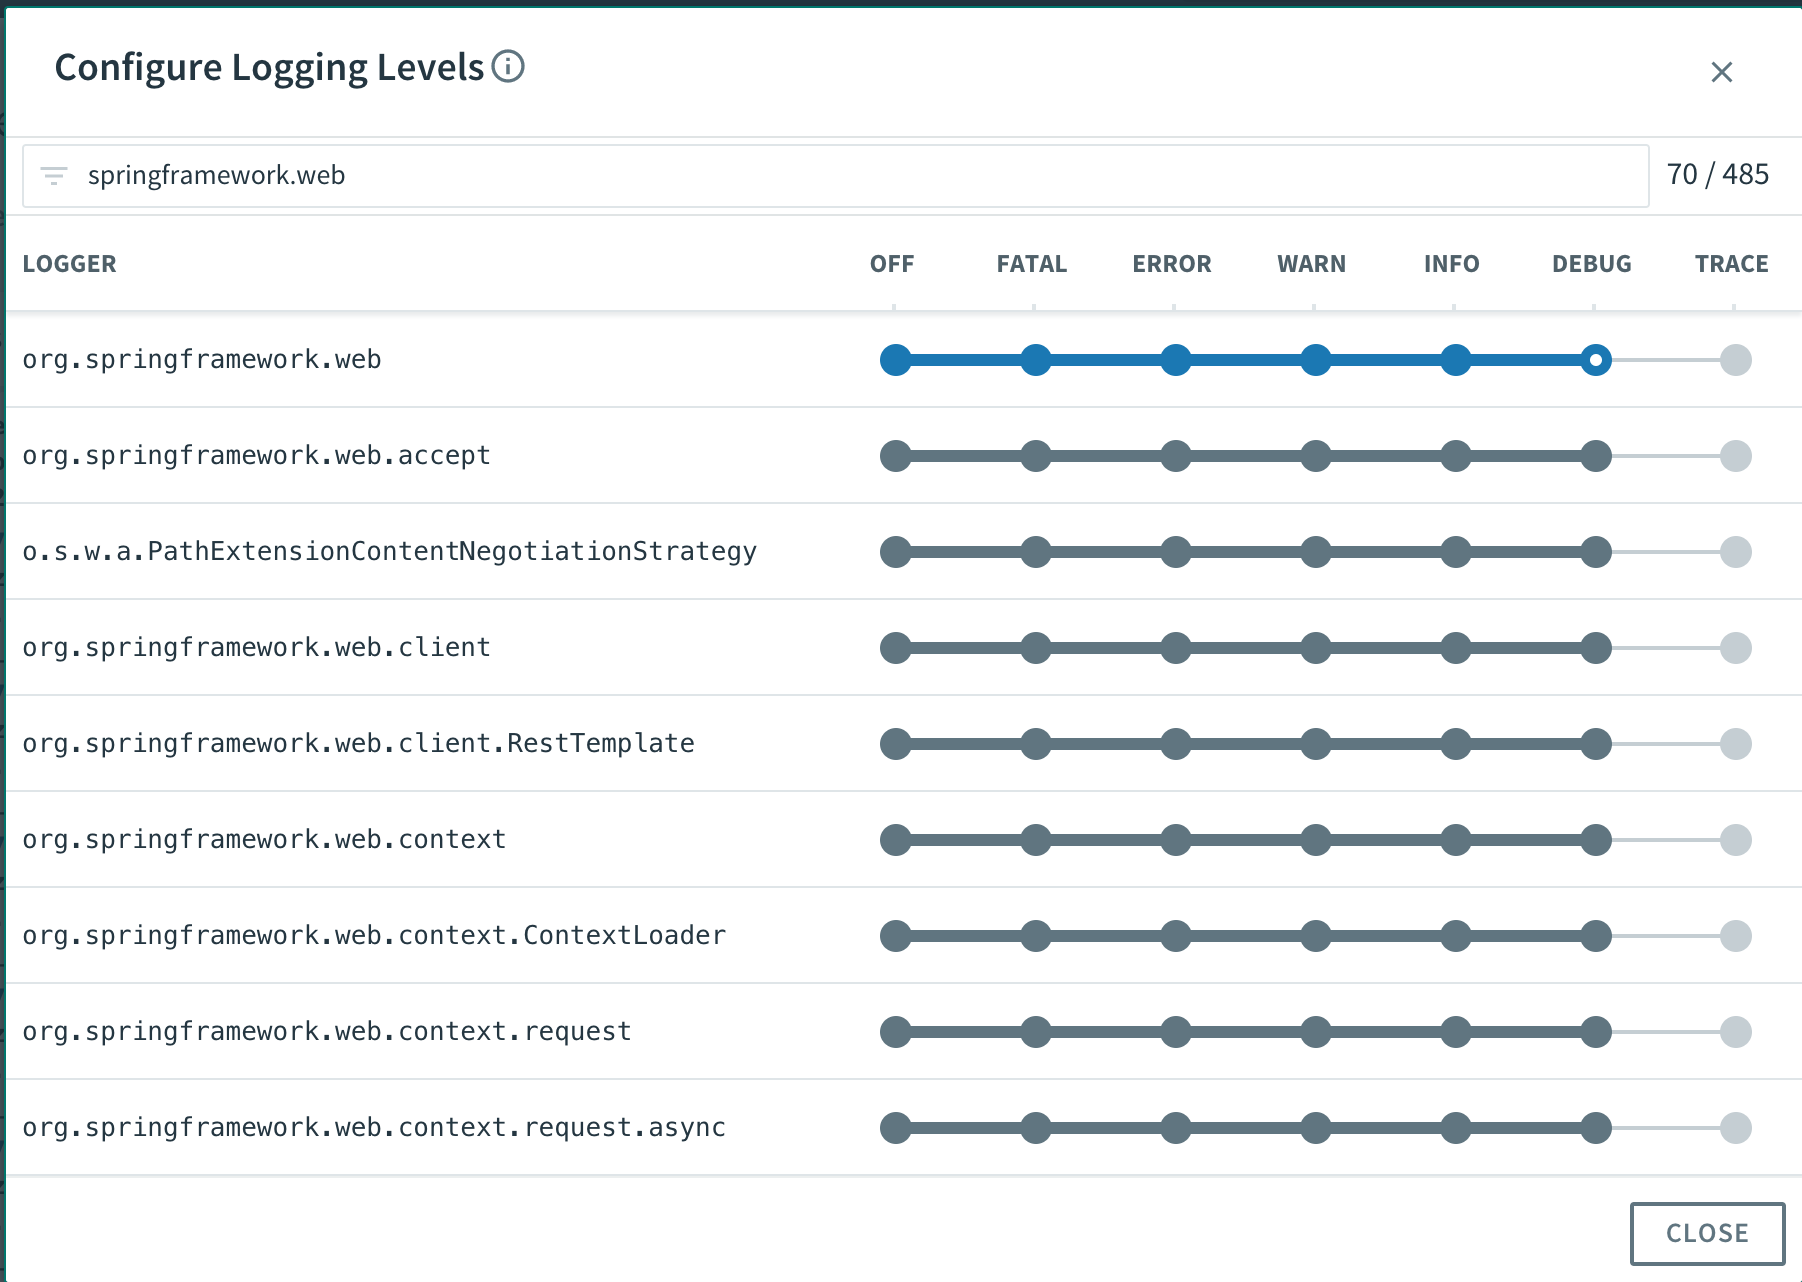
 変更したいレベルをクリックすれば、指定したロガーのレベル変更される。子のロガーのレベルも変更される。
 ちなみにSpring Bootアプリに限らず、▶︎ボタンを押せばログがWebSocketで流れてくる。
ここまでは、すでにサポートされていた機能である。
### dumpエンドポイント
ここから、新機能。まずはdumpエンドポイント。「Threds」タブを見ると、アプリケーションの現在のスレッド一覧と状態が表示される。
ちなみにSpring Bootアプリに限らず、▶︎ボタンを押せばログがWebSocketで流れてくる。
ここまでは、すでにサポートされていた機能である。
### dumpエンドポイント
ここから、新機能。まずはdumpエンドポイント。「Threds」タブを見ると、アプリケーションの現在のスレッド一覧と状態が表示される。
 スレッドをクリックすると、スレッドダンプが表示される。
 スケールアウトしている場合は、インスタンスの指定ができる。
スレッドの状態でフィルタリングもできる。
スケールアウトしている場合は、インスタンスの指定ができる。

スレッドの状態でフィルタリングもできる。
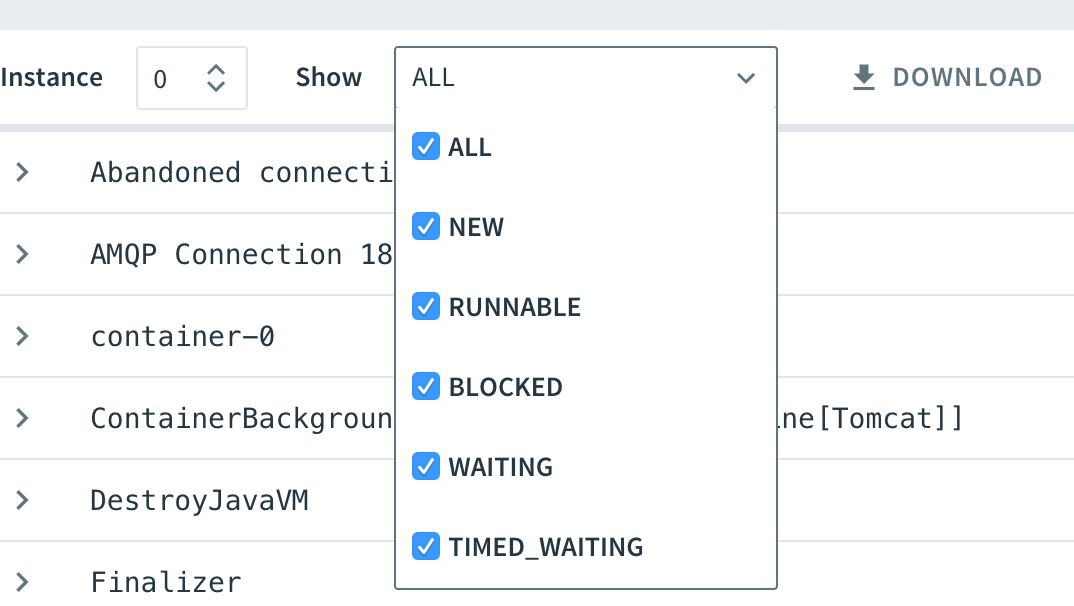 「Download」を押せばスレッドダンプがダウンロードされるし、「REFRESH」ボタンを押せばスレッドダンプが更新される。
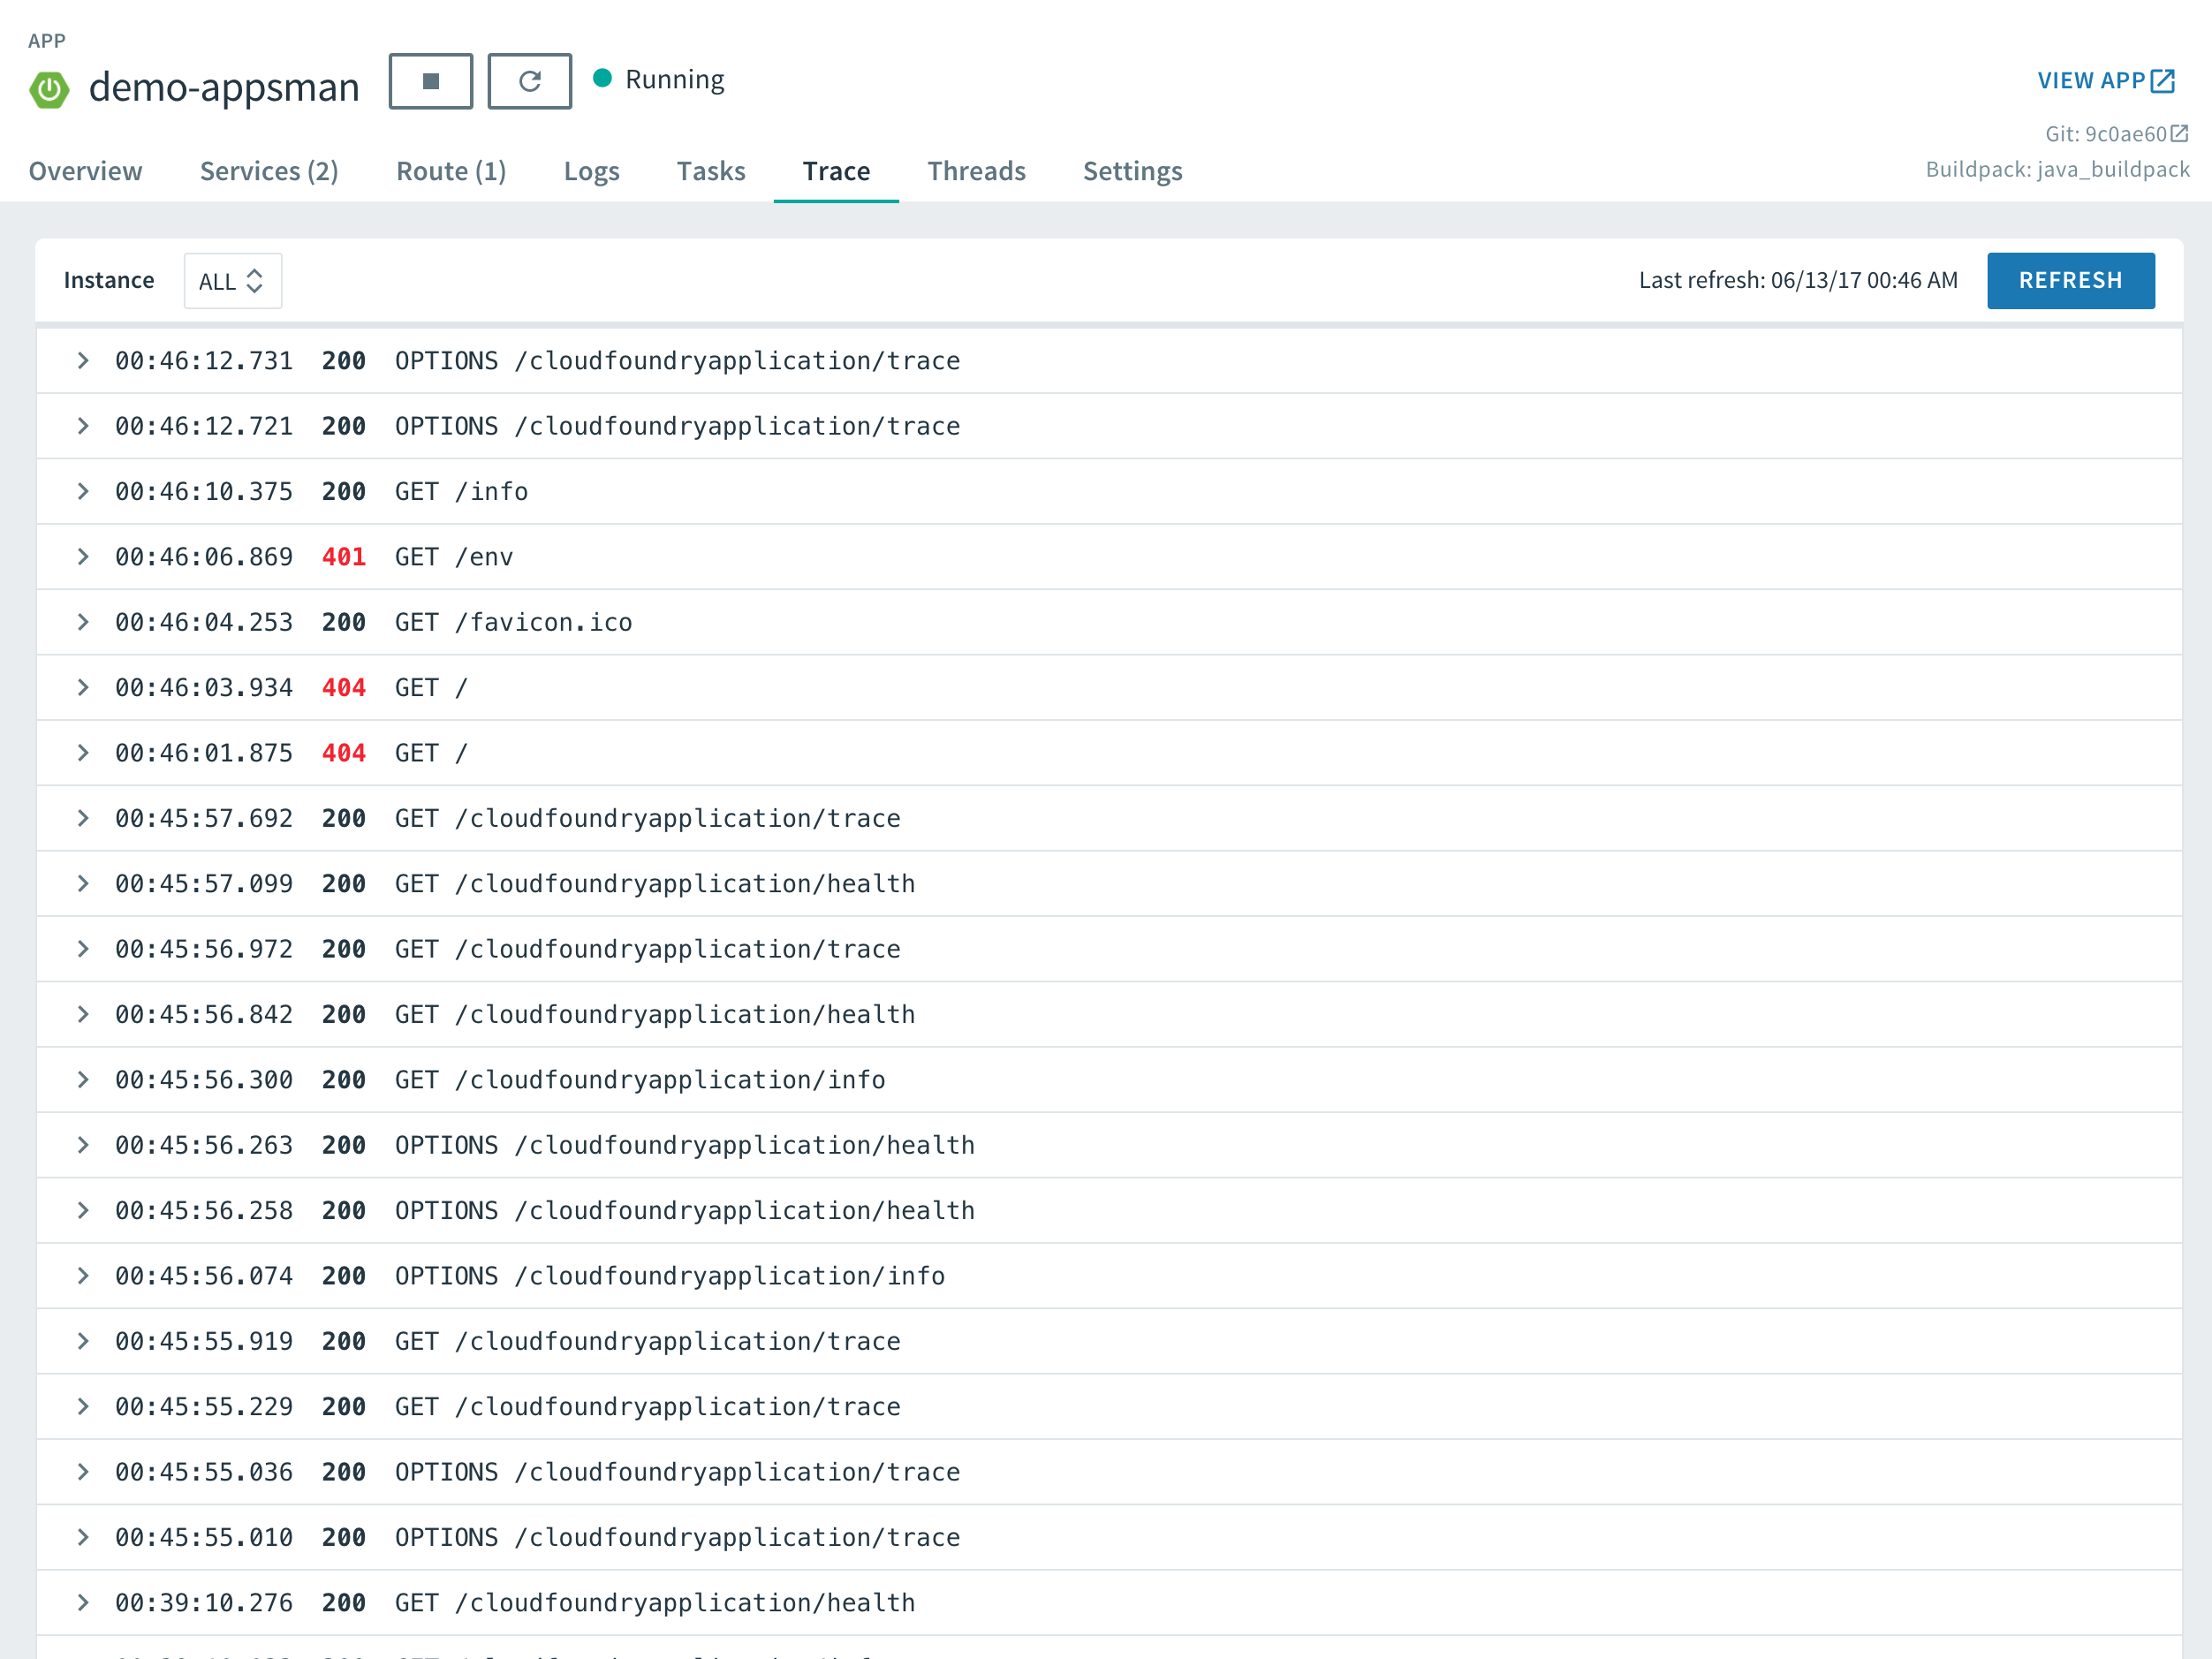
### traceエンドポイント
次にtraceエンドポント。「Trace」タブを見ると、直近のリクエストログされる。
「Download」を押せばスレッドダンプがダウンロードされるし、「REFRESH」ボタンを押せばスレッドダンプが更新される。
### traceエンドポイント
次にtraceエンドポント。「Trace」タブを見ると、直近のリクエストログされる。
 行を選択すると、そのリクエストのレスポンスタイムとリクエストヘッダ、レスポンスヘッダが表示される。
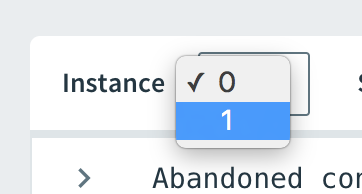
 デフォルトでは全インスタンスのリクエストログが集約されるが、インスタンスを指定することもできる。「REFRESH」ボタンを押せばリクエストログが更新される。

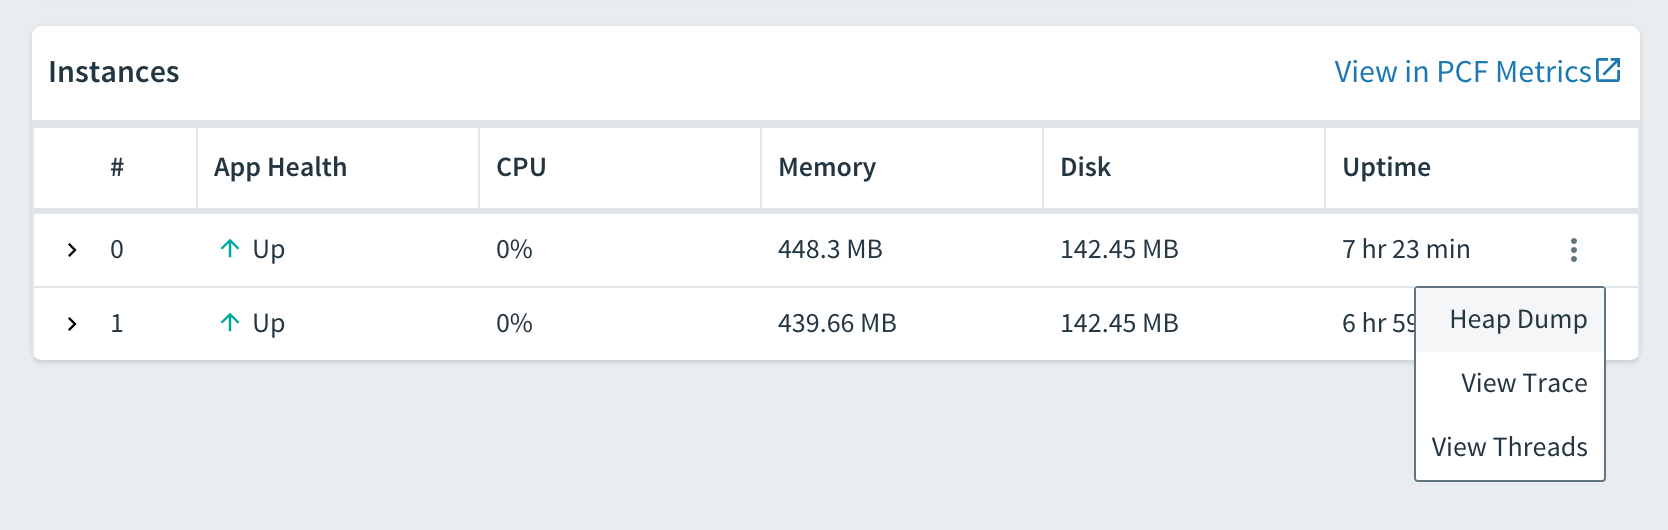
### heapdumpエンドポイント
最後にheapdumpエンドポイント。「Overview」タブの「Instances」欄で右端のボタンをクリックするとそのインスタンスのHeap Dump、Trace、Thread Dumpへのリンクが表示される。
デフォルトでは全インスタンスのリクエストログが集約されるが、インスタンスを指定することもできる。「REFRESH」ボタンを押せばリクエストログが更新される。

### heapdumpエンドポイント
最後にheapdumpエンドポイント。「Overview」タブの「Instances」欄で右端のボタンをクリックするとそのインスタンスのHeap Dump、Trace、Thread Dumpへのリンクが表示される。
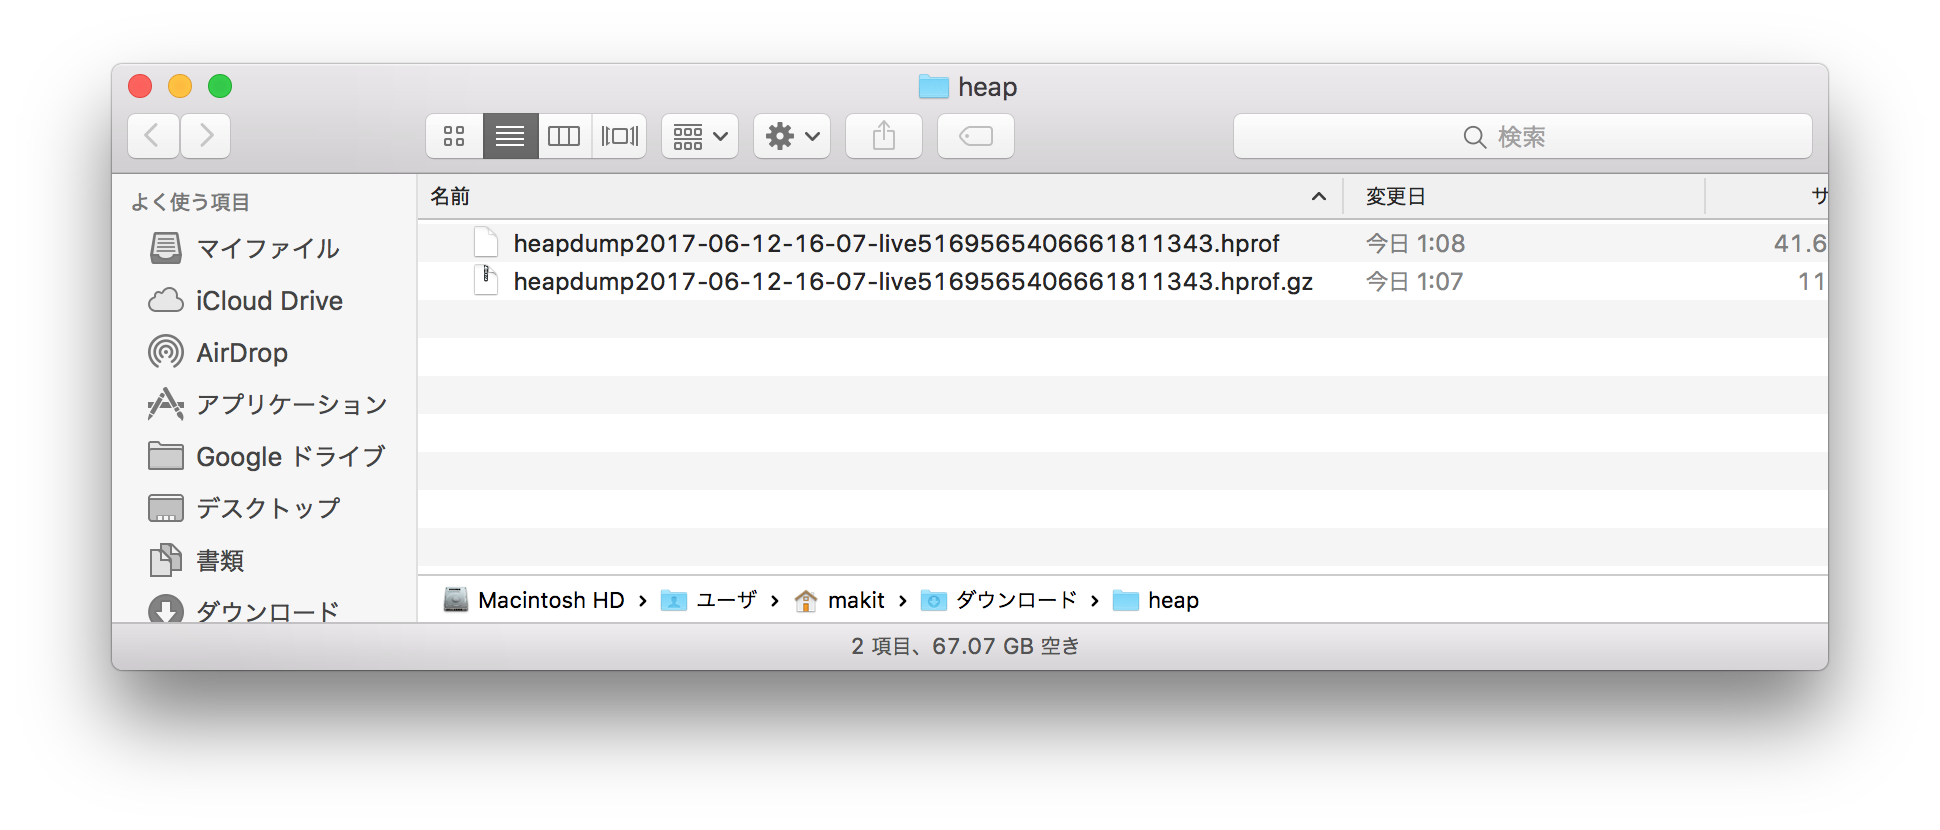
 「Heap Dump」をクリックすると、GZip形式でHeap Dumpがダウンロードできる。
 展開したファイルは`hprof`形式である。
 [Eclipse Memory Analyzer](http://www.eclipse.org/mat/)などでそのまま解析可能である。

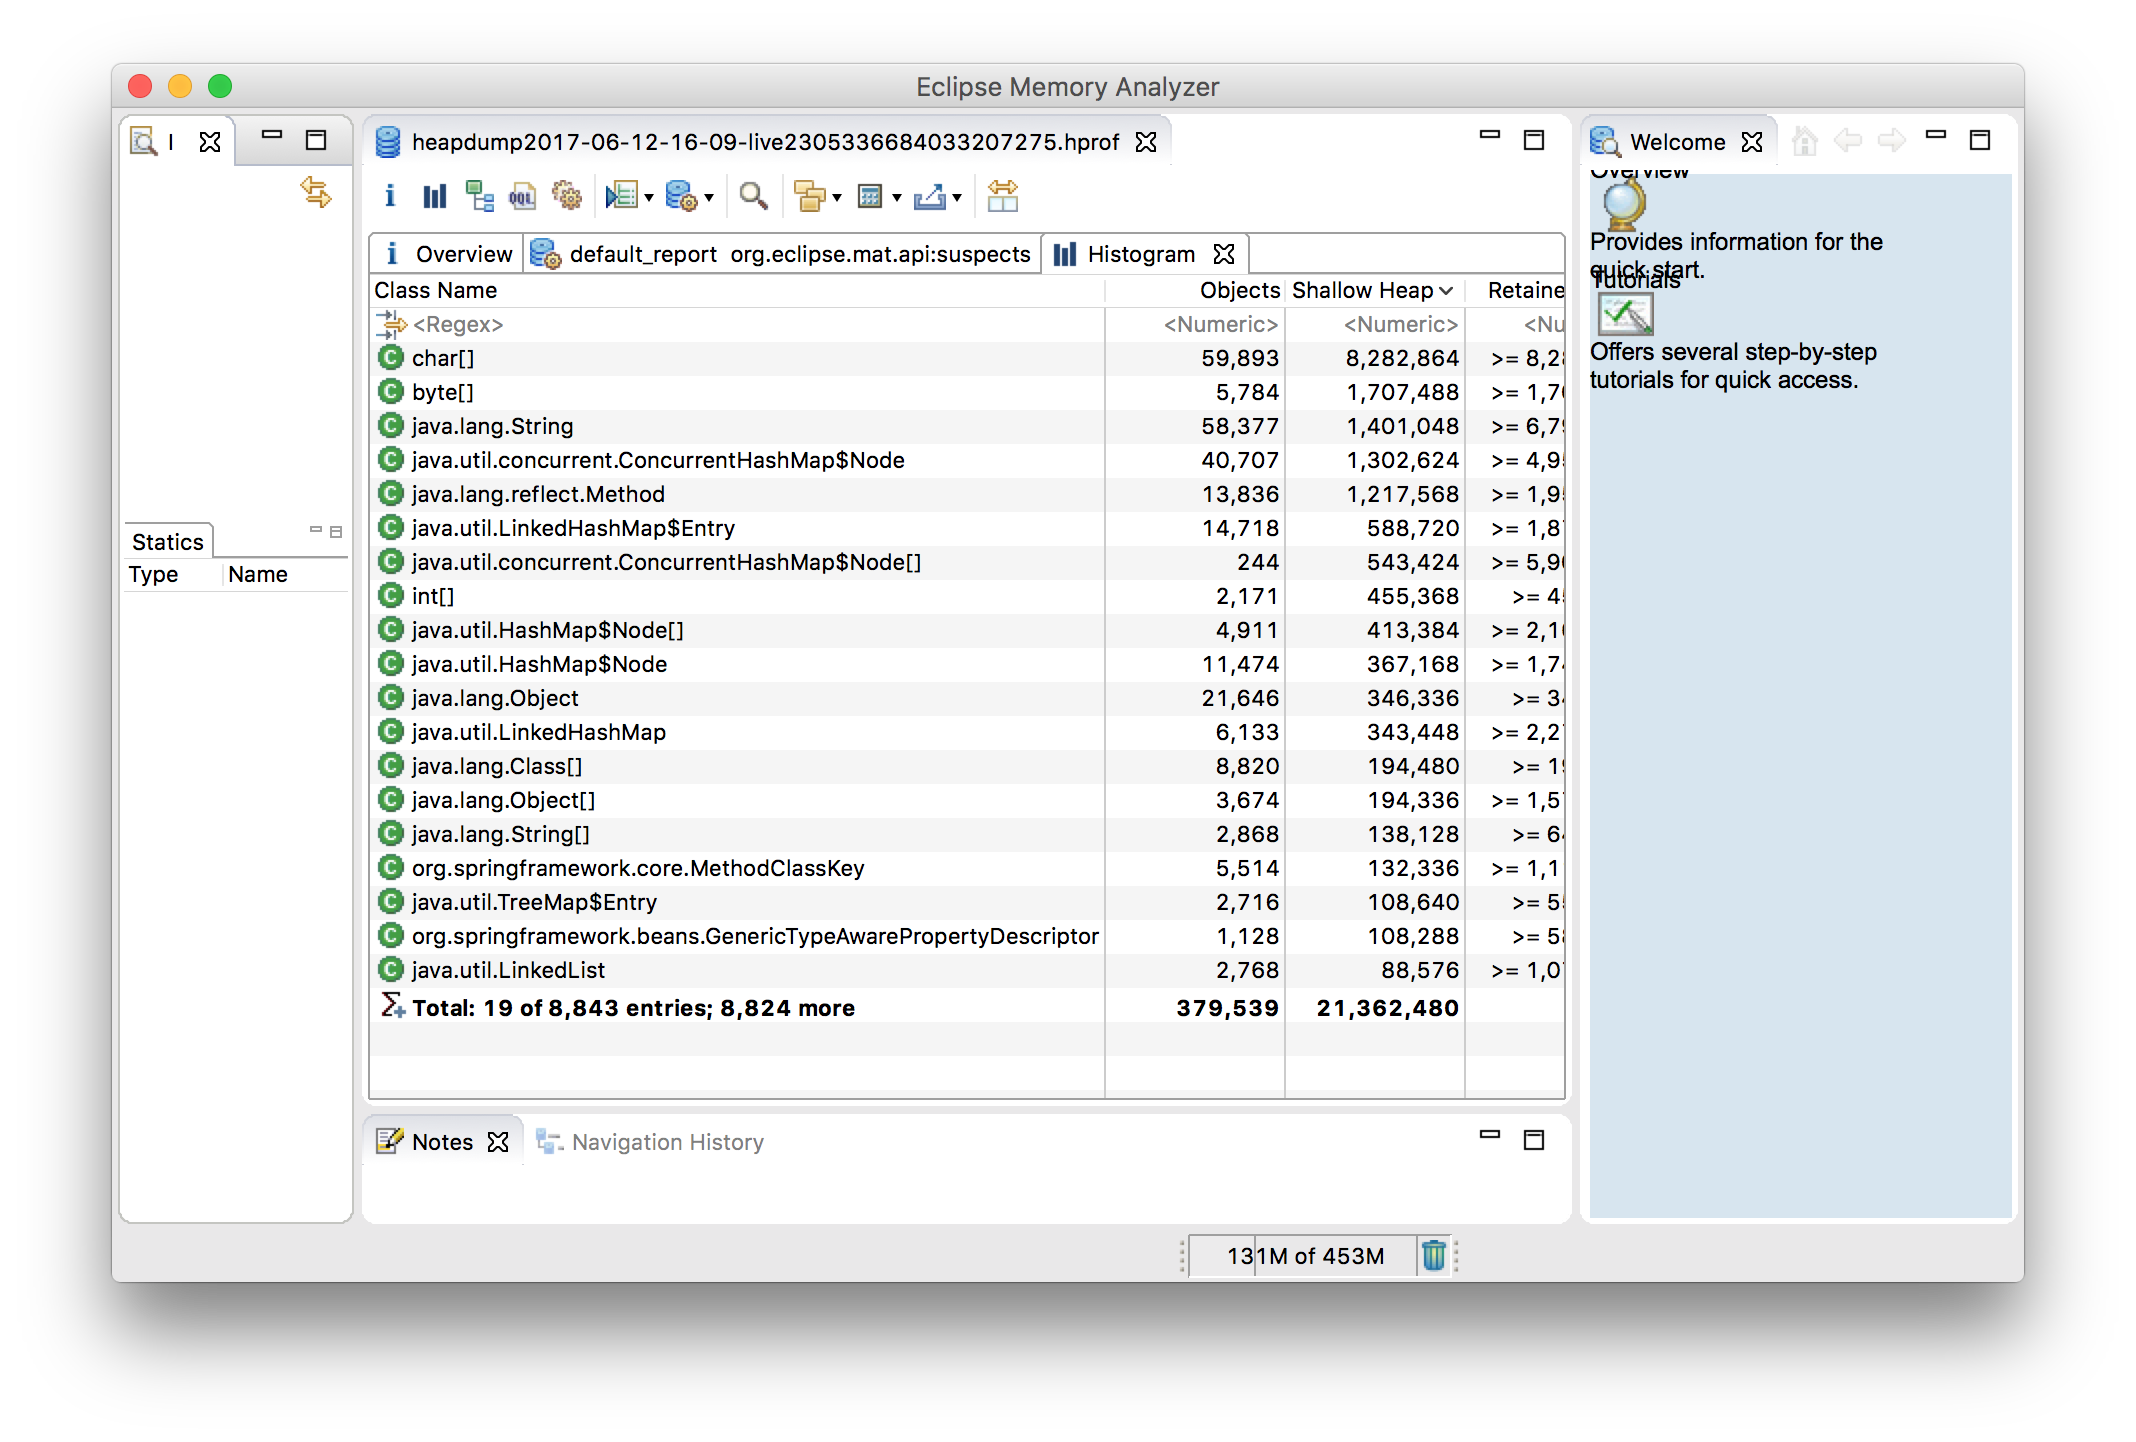 解析したいタイミングでWeb UIからHeap Dumpをダウンロードできるのはとても便利。
### まとめ
[Pivotal Web Services](https://run.pivotal.io)及び[Pivotal Cloud Foundry 1.11](https://docs.pivotal.io/pivotalcf/1-11/installing/pcf-docs.html)のSpring Boot Actuator連携を紹介した。
今後もActuator連携は強化されていくはず。個人的にはメトリクス連携が早く欲しい。
Actuator連携以外にも冒頭で示したようにCloud FoundryとSpring Bootの連携は多くあり、このブログで他の機能も紹介していく予定である。
> **追記**
>
> ↓の動画に言いたいことが全て詰まっていました。
>
>
Cloud FoundryはSpring Bootのベストなプラットフォームなので、Spring Bootでアプリを書いたらまずは[Pivotal Web Services](https://run.pivotal.io)にデプロイしてみてほしい。
解析したいタイミングでWeb UIからHeap Dumpをダウンロードできるのはとても便利。
### まとめ
[Pivotal Web Services](https://run.pivotal.io)及び[Pivotal Cloud Foundry 1.11](https://docs.pivotal.io/pivotalcf/1-11/installing/pcf-docs.html)のSpring Boot Actuator連携を紹介した。
今後もActuator連携は強化されていくはず。個人的にはメトリクス連携が早く欲しい。
Actuator連携以外にも冒頭で示したようにCloud FoundryとSpring Bootの連携は多くあり、このブログで他の機能も紹介していく予定である。
> **追記**
>
> ↓の動画に言いたいことが全て詰まっていました。
>
>
Cloud FoundryはSpring Bootのベストなプラットフォームなので、Spring Bootでアプリを書いたらまずは[Pivotal Web Services](https://run.pivotal.io)にデプロイしてみてほしい。